Evidence quality 4.0/5
Eight-dimension review score against the quality rubric . Each dimension scored 1–5.
- D1 Source grounding
- 4/5
- D2 Source authority
- 5/5
- D3 Arithmetic
- 4/5
- D4 Uncertainty
- 3/5
- D5 Scope
- 4/5
- D6 Prose
- 4/5
- D7 Perception honesty
- 4/5
- D8 Caveat completeness
- 4/5
≈ As likely as
Perceived
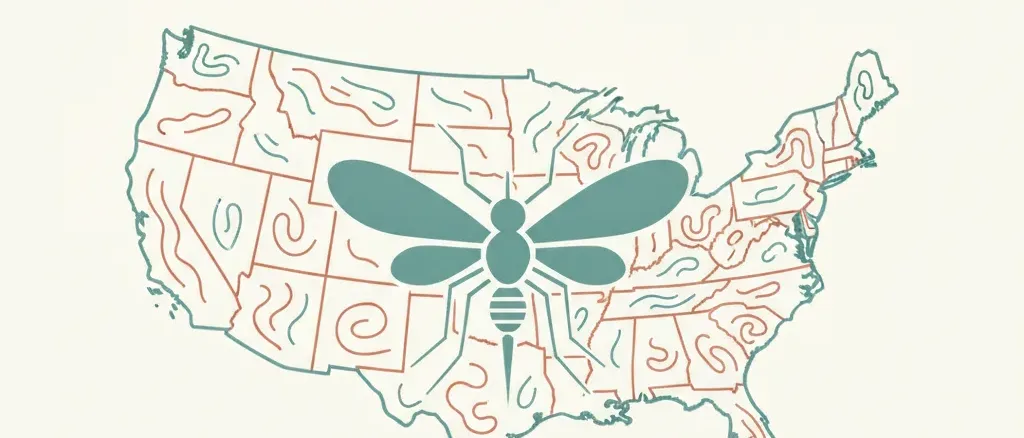
Most US residents file dengue under 'tropical travel disease' and assume zero risk while staying home. No published survey measures fear of catching dengue domestically, so this is an intuition read: the perceived domestic risk is effectively zero for nearly everyone, which understates the small but rising local-transmission risk in a few southern states and overstates the near-zero risk everywhere else. The mismatch is one of category error rather than magnitude.
Rough estimate: ≈ 0 (assumed to be a travel-only disease)
Source: editorial intuition, not polled
Actual
105 locally-acquired cases among ~338 million continental US residents in 2024
Residents of the 48 contiguous US states + DC, 2024
Show derivation
Subgroup = a person residing in the continental US (48 states + DC); horizon = 59-year remaining adult life (site default from age 18). Headline counts a DIAGNOSED clinical dengue case, not infection (40-80% of dengue infections are asymptomatic and many symptomatic cases go untested, so true infection risk is higher — this pushes the high bound up). Base annual rate from CDC MMWR 2024: 105 locally-acquired cases (Florida 85, California 18, Texas 2) / ~338M continental US residents = 3.1e-7 per person-year. Compounded over 59 years: 1-(1-3.1e-7)^59 = 1.83e-5 (~1 in 54,600), which is the 2024-RECORD-YEAR rate. 2024 was a +359% peak; before 2023 continental local transmission was near-zero in most years. Point estimate is set slightly BELOW the 2024-only figure at 1.5e-5 (~1 in 67,000) to average the recent peak against the much lower historical baseline, while leaning toward persistence because the entry's whole premise — Aedes range expansion and warming — is an upward trend. Low bound 1.5e-6 reflects pre-2023 near-zero local-transmission years (~10x below 2024). High bound 1.5e-4 reflects clinical undercount plus a worsening-transmission scenario (~10x above 2024). The 2-order-of-magnitude band is honest about a volatile, geographically concentrated, expanding risk rather than falsely precise.
Caveats: This is a snapshot of a volatile, geographically concentrated, and apparently ex…
This is a snapshot of a volatile, geographically concentrated, and apparently expanding risk, not a stable lifetime constant. The point estimate rests on a single record year (2024, +359% above the 2010–2023 average), and projecting that rate across a 59-year horizon assumes 2024-era local transmission persists — a deliberate lean toward the upward Aedes-range and warming trend the entry describes. The uncertainty band spans two orders of magnitude (~1 in 670,000 to ~1 in 6,700) precisely because year-to-year local-case counts swing wildly and the true infection rate is undercounted: 40–80% of dengue infections are asymptomatic and many symptomatic cases go untested, so the headline 'diagnosed case' rate is a floor on actual exposure. The risk is overwhelmingly a Florida (esp. Miami-Dade) and focal-California phenomenon; for a resident of most of the continental US it sits near the lower bound. No published survey measures fear of catching dengue domestically, so the perception read is an intuition, not a poll. Because the band is wide and the denominator is national while the risk is local, D4 (uncertainty) and D5 (scope) are the weakest dimensions; both are handled explicitly via subgroup scope and a regional_breakdown rather than a single misleading national headline. The entry does not assert dengue is endemic anywhere in the continental US — no US jurisdiction is officially classified as endemic.
How the risk varies
The headline figure averages across very different situations. Here’s how the probability varies by scenario or context:
1 in 4,545
85 of the 105 continental locally-acquired cases in 2024 (81%) were in Florida, across 10 counties but concentrated in the Miami-Dade area. 85 / ~23M Florida residents = 3.7e-6/yr → ~2.2e-4 (~1 in 4,600) over 59 yr; the Miami-Dade sub-rate is higher still. Florida is not officially endemic but reports local cases every year.
1 in 50,000
18 local cases statewide in 2024; LA County had 14 of them, all clustered within small radii consistent with focal outbreaks (some within a 1-mile radius over 7 weeks). 18 / ~39M = 4.6e-7/yr → ~2.7e-5 over 59 yr, but risk is concentrated in a few neighborhoods, not statewide.
1 in 666,667
Northern and interior states reported zero locally-acquired cases in 2024. Risk there is driven by occasional vector spread and remains near the lower bound.
Bar length and shade rank these scenarios against each other, not against other risks. The exact odds are shown beside each.
Related risks
Other risks on similar themes — for exploring related fears.

Vibrio vulnificus wound infection
What are the odds a US adult contracts a flesh-eating Vibrio vulnificus infection after warm-coastal-water exposure?

Aluminum & Alzheimer's
What are the odds of getting Alzheimer's disease from cooking with aluminum pots or foil?


Flu brain swelling in a child (IAE/ANE)
How likely is a child with influenza to develop sudden brain swelling (influenza-associated encephalopathy or acute necrotizing encephalopathy)?



Pick challenger
For most of the country, dengue is filed under tropical travel: a fever you bring back from Southeast Asia or the Caribbean, not something the mosquito on your own patio can give you. That filing is mostly correct and slowly going stale. In 2024 the United States recorded 3,798 dengue cases, a 359 percent jump above the 2010–2023 average. The headline number is dominated by travelers (97.2 percent), but 2.8 percent — 105 cases in the contiguous states — were locally acquired, meaning the patient had not left the reporting jurisdiction in the two weeks before symptoms began. Florida accounted for 85 of those, California 18, and Texas 2. The mosquito did the importing.
The national per-resident rate is small. Spread 105 cases across roughly 338 million continental residents and the annual odds are about 3 in 10 million; compounded over a typical adult lifetime, that lands near 1 in 67,000, in the same neighborhood as dying in a plane crash and a few times above being struck by lightning. The number is also nearly meaningless as a national figure, because the cases are not spread out. Eighty-one percent were in Florida, clustered around Miami-Dade, and California’s were not statewide but focal: a Los Angeles County investigation found 14 local cases between August and November 2024, several within a one-mile radius over seven weeks. For a resident of Miami the lifetime odds run into the low thousands; for a resident of Minnesota they sit at the floor.
Two things make the lifetime figure soft rather than firm. First, 2024 was a record year, and projecting a peak across 59 years assumes the surge holds — a bet the underlying trend supports, since Aedes aegypti and albopictus are established across the southeastern and southwestern US and continue to spread as temperatures climb. Second, the count undercounts: 40 to 80 percent of dengue infections produce no symptoms, and many that do are never tested, so 105 diagnosed cases is a floor on actual local exposure, not a ceiling. No US jurisdiction is officially endemic, and Florida’s health department still reports cases as locally acquired rather than expected. The honest summary is a wide band around a rising number, concentrated in a handful of southern counties, for a disease that no longer requires a passport.
Related tidbits
Dengue is usually filed as a travel-only disease, but it is not zero at home. There were 105 locally-acquired cases across the continental US in 2024, putting lifetime odds around 1 in 67,000. Rare, geographically clustered, and no longer purely imported.
Claim ledger
Every number below is what each source reported, with the verbatim quote we relied on and how we arrived at our figure. Click any link to verify directly.
2/5 sources independently verified verbatim against the cited source
-
[1] CDC Morbidity and Mortality Weekly Report (MMWR) — Increase in Travel-Associated and Locally Acquired Dengue Cases — United States, 2024
Increase in Travel-Associated and Locally Acquired Dengue Cases — United States, 2024See all 2 Likelier entries citing this source →
- Statistic
3,798 total US dengue cases in 2024 (+359% above the 2010–2023 average); 97.2% travel-associated, 2.8% locally acquired; continental US locally-acquired cases: Florida 85 (10 counties), California 18 (3 counties), Texas 2 (2 counties) = 105.- Excerpt
“During 2024, a record 3,798 dengue cases were reported [...] a 359% increase above the 2010–2023 annual average. Among these 3,798 cases, 97.2% were associated with travel outside the reporting jurisdiction during the 2 weeks preceding symptom onset; the remaining 2.8% were locally acquired. [...] Three jurisdictions reported locally acquired cases, including Florida (85 cases reported from 10 counties), California (18 from three counties), and Texas (two from two counties).”
- Source data from
- 2026-05-14
- Accessed
- 2026-06-13 · archived copy
- Calculation
- Locally-acquired continental total = 85+18+2 = 105. Annual rate = 105 / 338,000,000 continental residents = 3.1e-7/person-year. 59-year compounded = 1-(1-3.1e-7)^59 = 1.83e-5. This is the authoritative FINAL count; an earlier CDC HAN (March 2025) listed Florida as 91 preliminarily — the MMWR's 85 supersedes it.
-
[2] CDC Emerging Infectious Diseases — Investigation of and Response to Autochthonous Dengue, Los Angeles County, California, USA, August–November 2024 Verified
Investigation of and Response to Autochthonous Dengue, Los Angeles County, California, USA, August–November 2024- Statistic
14 locally-acquired dengue cases in LA County Aug–Nov 2024, geographically clustered (some within a 1-mile radius over 7 weeks), consistent with focal local transmission rather than diffuse community spread.- Excerpt
“During August–November 2024, a total of 14 locally acquired cases of dengue were identified in Los Angeles County, California, USA. [...] All 6 cases were identified within a 1-mile radius over a 7-week period, consistent with an outbreak involving ongoing local transmission.”
- Source data from
- 2026-05-06
- Accessed
- 2026-06-13 · archived copy
- Verification
- Excerpt independently re-fetched and confirmed word-for-word against the cited source during our grounding audit.
- Calculation
- Grounds the regional_breakdown claim that California's 18 cases were not statewide-uniform but concentrated in a few LA-area clusters. Supports treating local dengue as a focal/neighborhood risk, not a flat per-capita state rate.
- Independence
- Same publisher family (CDC) as the MMWR source but a distinct peer-reviewed field investigation with separate authors and data.
-
[3] CDC Health Alert Network (HAN) — Ongoing Risk of Dengue Virus Infections and Updated Testing Recommendations in the United States
Ongoing Risk of Dengue Virus Infections and Updated Testing Recommendations in the United States- Statistic
CDC advisory that dengue activity remained high into 2025 and that spring/summer raise both travel-associated and locally-acquired risk; 2024 local cases listed as Florida 91 (preliminary), California 18, Texas 1.- Excerpt
“Dengue activity remains high in some parts of the United States [...] Spring and summer travel coincide with the peak season for dengue in many countries, increasing the risk of both travel-associated and locally acquired cases.”
- Source data from
- 2025-03-18
- Accessed
- 2026-06-13 · archived copy
- Calculation
- Used to establish that the risk is ongoing/elevated rather than a one-off 2024 spike, supporting the upward-trend framing. Its preliminary Florida count (91) differs from the MMWR final (85); the entry uses the MMWR figure and flags the discrepancy in assumptions.
-
[4] CIDRAP, University of Minnesota — US dengue cases jumped 359% in 2024 amid global surge Verified
US dengue cases jumped 359% in 2024 amid global surge- Statistic
Confirms 3,798 total cases, 359% increase, 2.8% locally acquired, 105 locally-acquired nationwide with Florida 85 (81%); notes Aedes aegypti and albopictus are established across the southeastern/southwestern US and continue to spread as temperatures rise.- Excerpt
“Florida accounting for 85 of the 105 locally acquired cases (81%) reported nationwide [...] Ae aegypti and albopictus mosquitoes are found throughout large areas of the southeastern and southwestern United States and continue to spread to other regions [...] Vector presence and distribution might be further affected by increasing temperatures, which can expand the range of mosquitoes that spread dengue.”
- Source data from
- 2026-05-15
- Accessed
- 2026-06-13 · archived copy
- Verification
- Excerpt independently re-fetched and confirmed word-for-word against the cited source during our grounding audit.
- Calculation
- Independent confirmation of the MMWR 85/105 split and the vector-range-expansion premise that motivates the entry. Used for the Aedes-range and warming framing in the prose.
- Independence
- Independent academic center summarizing the MMWR; not a CDC publication.
-
[5] University of Florida Emerging Pathogens Institute — Dengue in Florida: What to know
Dengue in Florida: What to know- Statistic
Florida reported 1,044 local + travel-associated dengue cases in 2024 (most in the continental US); local cases concentrate in Miami-Dade County; no part of the US is officially endemic for dengue despite recurring local transmission.- Excerpt
“Although no part of the United States is officially labeled as endemic for dengue, Florida's health department continues to report cases acquired locally or linked to travel in 2025. [...] one case of locally acquired dengue in Miami-Dade County”
- Source data from
- 2025-06-24
- Accessed
- 2026-06-13 · archived copy
- Calculation
- Grounds the Florida/Miami-Dade concentration in the regional_breakdown and the 'not endemic' caveat. The 1,044 figure is local+travel combined (most are travel-associated); only the locally-acquired subset (85) feeds the native rate.