Skip to content
Likelier
Transport · reviewed 2026-04-11

What are the odds of a child being killed by a front-seat airbag?

Evidence quality 4.5/5

Eight-dimension review score against the quality rubric . Each dimension scored 1–5.

D1 Source grounding
5/5
D2 Source authority
5/5
D3 Arithmetic
4/5
D4 Uncertainty
4/5
D5 Scope
5/5
D6 Prose
4/5
D7 Perception honesty
4/5
D8 Caveat completeness
5/5
Average 4.5/5
Direct evidence

Lifetime probability · lifetime, activity-specific

1 in 10,000,000

0.00001% lifetime chance

range 1 in 100,000,000 to 1 in 1,000,000

lifetime, activity-specific each band = 10× rarer → zoomed to your factors See full scale →
certain 1 in 1K 1 in 1M 1 in 1B
1 in 10,000 1 in 100,000,000

● your factors — click this risk ▾ to reveal

≈ As likely as

A single empty child car seat on a pale background, flat vector illustration in muted tones, no vehicle, no airbag.

Perceived

"Kids belong in the back seat" is one of the stickiest pieces of parenting advice in the modern car-safety canon, and the airbag is usually cited as the reason. Parents who internalized the rule in the 1990s or 2000s often picture the front passenger airbag as an active threat to a buckled child on any given trip, rather than as a historical hazard that was largely engineered away by 2007. The perceived per-trip risk of a child being killed by an airbag deployment in a modern car is probably several orders of magnitude above the real one, even though the back-seat rule itself is still correct for independent crash-physics reasons.

Rough estimate: ~1 in 100,000 per trip feels plausible to most parents of small kids

Source: editorial intuition, not polled

Actual

~1 in 10,000,000 per child-trip in the front passenger seat (modern vehicle, correctly restrained)

children under 13 in post-2007 US passenger vehicles with advanced airbags, correctly belted

Show derivation

NHTSA's Special Crash Investigations attribute roughly 290 US deaths to frontal airbag inflation in low-speed crashes between 1990 and 2008, of which more than 90 percent (~260) were children and infants — the great majority unbelted or in rear-facing child seats in the front passenger position of 1st-generation airbag vehicles. Spread across ~18 years and the subset of child-trips actually taken in the front seat of airbag-equipped cars during that window, the historical per-trip rate for a correctly-restrained child was already below 1 in a million. For a child in a post-2007 advanced-airbag vehicle (dual-stage deployment, weight sensors, suppression for child-seat profiles) the yearly pediatric airbag-inflation death count has collapsed to near zero, implying a per-trip point estimate around 1e-7. The uncertainty band is wide because the numerator in recent years is a handful of cases, not a stable rate.

Caveats: This is primarily a historical risk entry. The "kids in the back seat" rule orig…

This is primarily a historical risk entry. The "kids in the back seat" rule originated from 1st-generation airbag deaths between roughly 1990 and 2000, but persists in parenting culture long after the specific mechanism (aggressive, single-stage, always-on inflation) was regulated out of new vehicles. In a modern vehicle the airbag-specific per-trip fatality risk to a correctly-restrained child is closer to lightning-strike territory than to car-crash territory. The back-seat rule is still the correct recommendation, but mostly for independent reasons — crash forces are lower in the rear, restraint geometry is better for small bodies, and adults up front aren't distracted turning around. Treat the airbag framing as the historical trigger for the rule, not its main modern justification.

Regional breakdown

The headline figure averages across very different populations. Here’s how the probability varies by geography or context:

Region / context Lifetime probability Notes
Modern vehicle (post-2007), child in back seat Not exposed to the front passenger airbag at all; this is the default configuration recommended by AAP and NHTSA.
Modern vehicle (post-2007), correctly-restrained child in front seat 1 in 10,000,000 Advanced airbags with occupant sensors and dual-stage deployment; pediatric inflation fatalities in recent years are near zero.
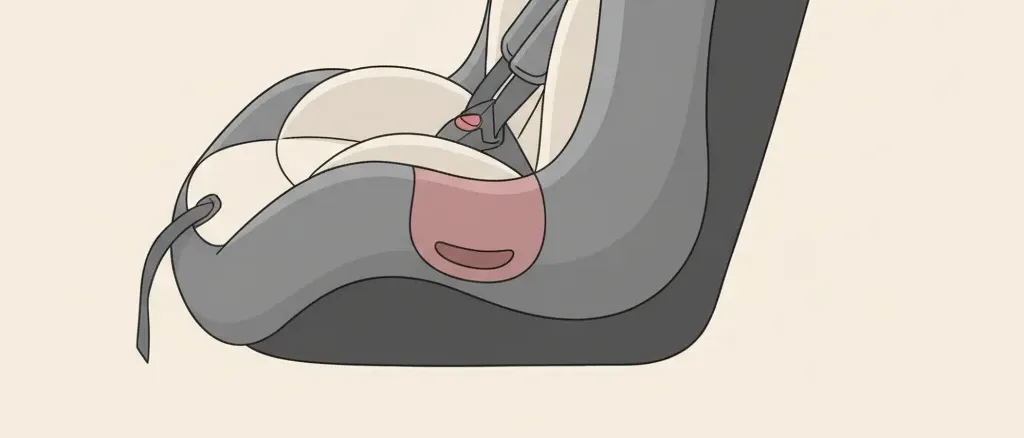
1990s vehicle, 1st-generation airbag, rear-facing infant in front seat 1 in 1,000 The canonical 1st-gen airbag hazard — the scenario that drove the back-seat rule into parenting culture.
1990s vehicle, 1st-generation airbag, small child unbelted or out of position 1 in 100 Most of the ~260 historical child inflation deaths fell in this or the previous category.

Risks at similar odds

Other risks with roughly the same likelihood — useful for calibration.

Transport

Child rear bike seat

What are the odds of serious injury to a child riding in a rear-mounted bike seat?

Transport

Child without restraint

How much more likely is a child to die in a car crash without an appropriate child restraint?

Transport

Child bike trailer

What are the odds of serious injury to a child riding in a towed bicycle trailer?

Transport

Child pedestrian (residential)

What are the odds of a young child being hit by a car after wandering onto a residential street?

Transport

Teen road-crash death

How likely is a teenager (15–19) to die in a road-traffic crash during those years?

Transport

Mishandled luggage

What are the odds of an airline losing or mishandling checked luggage?

Transport

Flight cancellation

What are the odds of having a flight canceled on any given trip?

Transport

Spaceflight (astronaut)

What are the odds of dying as an astronaut on a spaceflight mission?

Compare to:

NHTSA’s Special Crash Investigations attribute roughly 290 US deaths to frontal airbag inflation in low-speed crashes between 1990 and 2008, and more than 90 percent of those — around 260 people — were children and infants, most of them unbelted or in rear-facing child seats parked directly in front of a first-generation airbag. Spread across a decade and a half of child front-seat exposure, the per-trip fatality rate even then was already well under one in a million. That cluster of cases is the entire historical basis for the “kids belong in the back seat” rule, and it is why the rule exists in the form it does.

The modern picture is almost a different problem. The certified-advanced airbag rule phased in by the 2007 model year added occupant-weight sensors, dual-stage inflation, and automatic suppression when the front seat is occupied by a child safety seat. Pediatric airbag-inflation fatalities in the years since are a single-digit annual count at most, and for a correctly-restrained child in a recent-model vehicle the per-trip risk of being killed by the airbag itself is closer to 1 in 10,000,000 — roughly the same order of magnitude as being killed by a bolt of lightning on any given day. For a rear-facing infant in the front seat of a 1990s vehicle with a first-generation airbag, the risk was on the order of 1 in 1,000 — four orders of magnitude higher, and the reason every owner’s manual printed since carries the warning.

The rule persists anyway, and it should. Smith and Cummings’ 2006 matched-cohort study in Injury Prevention found that even in airbag-equipped cars, restrained children aged 0-12 in the back seat had an adjusted fatality risk ratio of 0.62 compared to the front — a 38 percent reduction driven mostly by lower crash forces and better restraint geometry in the rear, not by airbag avoidance per se. In other words, the “kids in back” rule is still the right advice, but the modern justification is overall crash survivability, not the airbag specifically. The airbag framing is a historical artefact of a hazard that has largely been engineered away; the back-seat recommendation is the part that survived the engineering.

Claim ledger

Every number below is what each source reported, with the verbatim quote we relied on and how we arrived at our figure. Click any link to verify directly.

  1. [1] Insurance Institute for Highway Safety (IIHS) — Airbags
    Airbags
    Statistic
    NHTSA estimates >290 US deaths from frontal airbag inflation in low-speed crashes, 1990-2008; >90% were children and infants
    Excerpt
    “"NHTSA estimates that during 1990-2008, more than 290 deaths were caused by frontal airbag inflation in low-speed crashes. More than 90% of those were children and infants, most of whom were unbelted or in rear-facing child safety seats that placed their heads close to the deploying airbag." ”
    Source data from
    2024-01-01
    Accessed
    2026-04-11 · archived copy
    Calculation
    Take ~290 total inflation-attributable deaths × 0.9 ≈ 260 child deaths across 1990-2008 (~18 years). US child-trips in the front passenger seat of airbag-equipped vehicles during that window are on the order of tens of billions; even on a conservative denominator of ~2e9 exposed child-trips the historical per-trip rate for unbelted or improperly-restrained children is roughly 1e-7 and for correctly-restrained kids is an order of magnitude lower. Post-2007 advanced airbags (mandated by the certified-advanced rule) then cut the numerator by roughly another order of magnitude. The 1e-7 headline is the midpoint of that range for a correctly-restrained child in a modern vehicle.
    Independence
    IIHS is summarizing NHTSA Special Crash Investigation (SCI) data; it is not an independent measurement. Treat the 290/90% figures as a single NHTSA-sourced estimate with two presentations.
  2. [2] Injury Prevention (BMJ) — Smith & Cummings, 2006 — Passenger seating position and the risk of passenger death in traffic crashes: a matched cohort study
    Passenger seating position and the risk of passenger death in traffic crashes: a matched cohort study
    Statistic
    Adjusted risk ratio for restrained children 0-12 years, rear vs front seat, vehicles with front passenger airbag: 0.62 (95% CI 0.48-0.81)
    Excerpt
    “"For restrained passengers in cars with a front passenger airbag, the aRR was 0.62 (95% CI 0.48 to 0.81) for children 0-12 years." ”
    Source data from
    2006-04-01
    Accessed
    2026-04-11 · archived copy
    Calculation
    The 0.62 adjusted risk ratio is not used to compute the native per-trip number; instead it anchors the statement that the back seat is still the better position for children in airbag-equipped cars as a matter of overall crash mortality, not just airbag-inflation mortality. It is the strongest peer-reviewed evidence that the "kids in back" rule has independent justification even after 1st-generation airbags were phased out.
    Independence
    Smith & Cummings draw on FARS/GES crash data, which NHTSA also uses. They are not fully independent of the IIHS/NHTSA inflation-death figure but answer a different question (overall fatality risk by seat position, not inflation-attributable deaths).
  3. [3] American Academy of Pediatrics (HealthyChildren.org) — Air Bag Safety for Children
    Air Bag Safety for Children
    Statistic
    AAP recommends all children under 13 ride in the back seat; rear-facing infants must never ride in front of an active airbag
    Excerpt
    “"The safest place for all infants and children younger than 13 years to ride is in the back seat." ”
    Source data from
    2023-01-01
    Accessed
    2026-04-11 · archived copy
    Calculation
    Used as the authoritative pediatric-policy citation explaining why the back-seat rule persists regardless of the dramatic reduction in airbag-inflation fatalities since 2007. Not used in the per-trip arithmetic.
    Independence
    Policy document, not a primary data source — independent of NHTSA/IIHS crash data but also not a quantitative estimate.
  4. [4] NHTSA, National Center for Statistics and Analysis — Evaluation of the Certified-Advanced Air Bags (DOT HS 811 834)
    Evaluation of the Certified-Advanced Air Bags (DOT HS 811 834)
    Statistic
    Certified-advanced airbags (mandated 2003-2006) reduced child right-front fatality risk by 5%; annual airbag fatalities dropped from 52 to near-zero post-2007
    Excerpt
    “"During 1990-2008, more than 290 deaths were caused by frontal airbag inflation in low-speed crashes. More than 90% were children and infants. Nearly 90% of the deaths occurred in vehicles manufactured before 1998." ”
    Source data from
    2013-09-01
    Accessed
    2026-04-12 · archived copy
    Calculation
    Primary NHTSA government evaluation of advanced airbag systems. The near-zero child fatality count post-2007 anchors the entry's 1e-7 per-trip estimate for modern vehicles. This is the upstream report the existing IIHS source summarizes.
    Independence
    NHTSA is the upstream data source for the IIHS summary — not independent but provides the authoritative government publication directly.

412 risks with measured probability
1 in 10 1 in 100 1 in 1K 1 in 10K 1 in 100K 1 in 1M 1 in 10M 1 in 100M 1 in 1B certain rarer → Cosmetic surgery abroad risk — 1 in 10 Infant sugar/salt and adult disease — 1 in 10 Endometriosis — 1 in 10 Hair transplant Turkey risk — 1 in 10 Knee replacement — 1 in 10 Chronic painkillers — 1 in 10 Elderly abandonment — 1 in 9.1 Complete tooth loss — 1 in 9.1 Alzheimer's — 1 in 8.3 Sleep deprivation — 1 in 8.3 Smokeless tobacco — 1 in 8.3 Cycling w/o helmet — 1 in 8.0 Bruxism tooth damage — 1 in 7.7 Vision loss — 1 in 6.7 Hernia from lifting — 1 in 6.7 Hip fracture risk — 1 in 6.7 Regular drinking — 1 in 6.7 First heart attack — 1 in 5.9 Infertility — 1 in 5.7 5+ years paid LTC — 1 in 5.6 CTE (football) — 1 in 5.0 Major depression — 1 in 4.9 Hiking injury — 1 in 4.8 Infection from sharing food with child — 1 in 4.2 Lyme disease — 1 in 4.0 Loneliness & health — 1 in 3.8 Job loss & depression — 1 in 3.7 Inheriting AUD risk — 1 in 3.5 Alcohol use disorder — 1 in 3.4 Menopause CV risk acceleration — 1 in 3.0 Silent diabetes — 1 in 3.0 Flying with cold — 1 in 2.9 Tick illness (forest) — 1 in 2.9 Silent high cholesterol — 1 in 2.9 Grandparent loss in childhood — 1 in 2.8 Pacifier floor drop — 1 in 2.8 Drug-resistant infection — 1 in 2.6 No marrow match — 1 in 2.4 Nursing home admission — 1 in 2.2 Skipping dental checkups — 1 in 2.1 False-positive mammogram — 1 in 2.0 Regular smoking — 1 in 2.0 Travelers' diarrhea — 1 in 2.0 Adventure sports — 1 in 1.8 Family caregiver probability — 1 in 1.8 LTC need after 65 — 1 in 1.8 Widowhood probability — 1 in 1.7 Unprotected sex — 1 in 1.5 Silent hypertension — 1 in 1.3 Chronic back pain — 1 in 1.3 Hand hygiene — 1 in 1.0 Cancer (any) — 1 in 7.1 E-scooter no helmet — 1 in 4.5 E-bike no helmet — 1 in 4.0 Mishandled luggage — 1 in 3.7 Deer collision — 1 in 2.7 At-fault injury crash — 1 in 2.5 Flight cancellation — 1 in 1.8 Trip disruption: war or disaster — 1 in 1.7 Home burglary (global) — 1 in 9.1 Hitchhiking assault — 1 in 8.8 Mail check fraud — 1 in 7.7 Child sexual abuse — 1 in 6.8 Stalking — 1 in 6.2 Student sexual assault — 1 in 5.7 Domestic violence — 1 in 3.7 Night walk assault — 1 in 3.6 Bicycle theft — 1 in 2.9 Sexual assault — 1 in 2.9 Home burglary — 1 in 2.6 Sexual harassment (lifetime) — 1 in 1.6 Water scarcity — 1 in 2.5 Carrington-class solar storm — 1 in 1.9 WAIS tipping point — 1 in 1.1 Indoor cat escape harm — 1 in 10 Off-leash dog bite — 1 in 8.9 Rabbit dies in 4 years — 1 in 3.3 Dog bite (non-fatal) — 1 in 1.8 Hamster dies before teenager — 1 in 1.0 Vitamin D gap — 1 in 2.9 Undercooked food — 1 in 1.6 Raw meat cross-contamination — 1 in 1.4 Food left out — 1 in 1.2 AI voice scam — 1 in 2.9 Online scam loss — 1 in 2.5 Teen cyberbullying — 1 in 2.0 Kids & explicit content — 1 in 1.9 Data breach — 1 in 1.1 Miscarriage — 1 in 6.7 Teen suicide attempt — 1 in 5.6 Postpartum depression — 1 in 4.8 Painkiller before infant vaccination — 1 in 3.8 Excessive pregnancy weight — 1 in 2.6 Unvaxxed child & measles — 1 in 2.0 Elder fraud loss — 1 in 10 Pension fund collapse — 1 in 10 Personal bankruptcy — 1 in 10 Housing crash — 1 in 8.3 Crypto total loss — 1 in 6.7 IRS audit — 1 in 6.7 Visa overstay deportation — 1 in 5.6 Long term disability working age — 1 in 4.0 Student loan default — 1 in 3.8 Whistleblower retaliation — 1 in 3.2 Career obsolescence — 1 in 2.9 Forced job exit before retirement — 1 in 2.9 Retirement shortfall — 1 in 2.6 Divorce — 1 in 2.4 Burst pipe damage — 1 in 2.2 Workplace bullying — 1 in 2.1 Deportation (undocumented) — 1 in 1.8 Funeral cost shock — 1 in 1.8 Identity theft — 1 in 1.7 Credit card fraud — 1 in 1.5 School bullying — 1 in 1.5 Insurance claim denial — 1 in 1.4 Frontline soldier casualty — 1 in 1.3 Economic recession — 1 in 1.0 Stock market crash — 1 in 1.0 Hail roof damage — 1 in 3.0 Dry toilet paper harm — 1 in 100 Secondhand smoke — 1 in 91 Gaming disorder (adults) — 1 in 83 High-heel ER visit — 1 in 79 Child throwing object — 1 in 67 Medication reaction — 1 in 58 Cat litter toxoplasmosis — 1 in 48 Mental health LTD claim — 1 in 45 Drug overdose — 1 in 42 Benzo dependence — 1 in 40 Tap water lead — 1 in 40 Medication misuse — 1 in 35 Traumatic brain injury — 1 in 33 Hospital infection — 1 in 31 Air pollution — 1 in 29 End-stage kidney disease — 1 in 29 Traveler's diarrhea (water) — 1 in 26 Skiing injury — 1 in 26 Bipolar disorder — 1 in 23 Dental tourism complication — 1 in 20 Pet parasites — 1 in 20 Undiagnosed ADHD — 1 in 20 Adult-onset food allergy — 1 in 19 Indoor cooking smoke — 1 in 18 Non-Alzheimer's dementia — 1 in 17 Working-age disabling stroke — 1 in 17 Cannabis use disorder — 1 in 16 Stroke — 1 in 15 Parent death/disability — 1 in 14 Severe hearing loss — 1 in 14 Type 2 diabetes — 1 in 13 Appendicitis — 1 in 13 Untreated depression — 1 in 13 Untreated back pain disability — 1 in 13 Heart disease — 1 in 12 Medical error death — 1 in 12 Compulsive sexual behavior — 1 in 12 Eating disorder — 1 in 11 Hip replacement — 1 in 11 Kidney stones — 1 in 11 Sedentary lifestyle — 1 in 11 Salon infection — 1 in 11 Ovarian cancer — 1 in 91 Colorectal cancer — 1 in 77 Breast cancer — 1 in 59 Liver cancer — 1 in 59 Lung cancer — 1 in 56 Prostate cancer — 1 in 50 Melanoma (UV) — 1 in 29 Low-fiber CRC risk — 1 in 23 Red meat & CRC — 1 in 21 Charred meat & cancer — 1 in 20 Maintenance crash — 1 in 83 Driving on sedating meds — 1 in 77 Texting + driving — 1 in 56 Driving after cannabis — 1 in 53 Eating while driving — 1 in 53 Unbelted crash death — 1 in 53 Speeding 20% over limit — 1 in 48 Motorcycle no helmet — 1 in 45 Spaceflight (astronaut) — 1 in 42 Video watching + driving — 1 in 32 Drowsy driving — 1 in 26 E-scooter injury — 1 in 26 Cruise ship norovirus — 1 in 24 Driving at 0.10% BAC — 1 in 16 Catalytic converter theft — 1 in 83 Pickpocketed while traveling — 1 in 38 Stabbed in an assault — 1 in 37 Vehicle theft — 1 in 34 Street robbery / mugging — 1 in 26 Wrongful conviction — 1 in 24 Drink spiking — 1 in 17 Protest under autocracy — 1 in 12 AMOC collapse — 1 in 20 Sting anaphylaxis — 1 in 50 Cat collar injury — 1 in 25 Fish bone injury — 1 in 68 Restaurant food poisoning — 1 in 58 Vegetarian deficiency — 1 in 25 Intimate deepfake — 1 in 25 Social media problematic use — 1 in 13 Infant fall — 1 in 100 Childbirth death (SSA) — 1 in 55 Co-sleeping death — 1 in 43 Toddler stair fall — 1 in 37 Play swing & slide injury — 1 in 33 Autism diagnosis — 1 in 31 C-section complications — 1 in 29 Toy injury requiring ER (child) — 1 in 21 Preeclampsia — 1 in 20 Severe birth tearing — 1 in 17 Gestational diabetes — 1 in 13 Child fall head injury — 1 in 12 Sports betting financial ruin — 1 in 100 Fighter pilot death — 1 in 48 Commercial fishing career death — 1 in 45 Logging career death — 1 in 34 Dying without heir — 1 in 33 Medical bankruptcy — 1 in 25 Compulsive buying disorder — 1 in 20 Rental listing scam loss — 1 in 20 Mortgage foreclosure — 1 in 14 Musculoskeletal LTD claim — 1 in 14 Day-trading losses — 1 in 13 Extremist govt catastrophe — 1 in 13 Hurricane home destruction — 1 in 17 LASIK complications — 1 in 1,000 Infant pool submersion — 1 in 800 MS — 1 in 769 Workplace fatality — 1 in 690 Typhoid fever — 1 in 654 Unsafe imported products — 1 in 565 Brain aneurysm — 1 in 400 COVID-19 — 1 in 400 Fireworks injury — 1 in 385 Sickle cell disease — 1 in 365 Counterfeit medicine — 1 in 361 Spinal cord injury — 1 in 313 Childhood cancer diagnosis — 1 in 285 Next pandemic death — 1 in 208 Dengue (travel) — 1 in 200 Skipping daily showers — 1 in 200 Not scrubbing feet — 1 in 200 Marrow donation risk — 1 in 167 Schizophrenia — 1 in 143 Accidental fall — 1 in 135 Parkinson's — 1 in 125 Sudden death during exercise — 1 in 123 Suicide (US) — 1 in 121 Opioid addiction — 1 in 114 Tuberculosis (global) — 1 in 108 Radon cancer — 1 in 435 Testicular cancer — 1 in 250 Cervical cancer — 1 in 167 Pancreatic cancer — 1 in 125 Pedestrian death — 1 in 806 Motorcycle crash — 1 in 694 Boating drowning — 1 in 685 Driver kills pedestrian — 1 in 552 Phone-distracted walking injury — 1 in 400 EV battery fire — 1 in 333 Cyclist killed by car — 1 in 196 Hand-held phone call + driving — 1 in 143 Petrol car fire — 1 in 125 Self-driving car fatality — 1 in 115 Car crash — 1 in 105 Firefighter duty death — 1 in 455 Police duty death — 1 in 313 Homicide — 1 in 287 Pig-butchering scam — 1 in 106 Extreme heat — 1 in 333 Climate change death — 1 in 204 Swallowed bee/wasp — 1 in 500 Bat bite & rabies — 1 in 238 Mosquito-borne disease — 1 in 190 Food poisoning (global) — 1 in 317 Solar panel fire — 1 in 667 Untreated childhood scoliosis — 1 in 1,000 Child window fall — 1 in 855 Walker stair fall — 1 in 625 Baby walker injury — 1 in 455 Maternal mortality — 1 in 272 Untreated childhood flat feet — 1 in 250 Maternal age & birth defects — 1 in 200 Child death (<18) — 1 in 143 Caving career death — 1 in 167 EMS duty death — 1 in 794 Civilian war casualty — 1 in 499 Soldier in combat — 1 in 270 Mining career death — 1 in 214 Gambling financial ruin — 1 in 159 Wildfire home destruction — 1 in 120 Lightning home fire — 1 in 105 Malaria (travel) — 1 in 10,000 Infection from shared drink — 1 in 10,000 Chagas disease — 1 in 8,475 Wild berry fox tapeworm — 1 in 8,475 Schistosomiasis death — 1 in 6,667 Sudden death (young adult) — 1 in 3,922 Unsafe wiring — 1 in 3,390 Sepsis from wound — 1 in 2,857 Anesthesia awareness — 1 in 2,500 Heat stroke (outdoor) — 1 in 1,905 House fire — 1 in 1,818 Rabies from dogs — 1 in 1,449 Drowning — 1 in 1,379 Shallow-water diving SCI — 1 in 1,111 Choking — 1 in 1,099 EVALI vaping hospitalization — 1 in 1,064 Betel nut cancer — 1 in 1,290 Blood clot (flight) — 1 in 4,651 Killing a cyclist — 1 in 3,937 Teen road-crash death — 1 in 3,030 Child rear bike seat — 1 in 2,500 Child without restraint — 1 in 2,000 Fatal police encounter — 1 in 4,739 Honor killing — 1 in 2,381 Intimate-partner homicide — 1 in 1,767 Hurricane — 1 in 8,929 Drought famine death — 1 in 6,536 Blizzard death — 1 in 4,367 Earthquake — 1 in 3,802 Dog chocolate death — 1 in 2,000 Food poisoning (US) — 1 in 1,862 Fish mercury — 1 in 1,695 Phone/laptop battery fire — 1 in 1,136 SIDS — 1 in 7,143 Laundry pod ingestion — 1 in 6,494 Untreated infant hip dysplasia — 1 in 5,000 Pool drowning — 1 in 2,299 War (civilian) — 1 in 2,000 Fatal bee/wasp sting — 1 in 76,923 Anesthesia death — 1 in 50,000 Dog hot car death — 1 in 41,667 Anaphylaxis — 1 in 27,548 Chiropractic neck manipulation — 1 in 16,667 CO poisoning — 1 in 14,006 Hepatitis A (travel) — 1 in 12,500 Skipping allergy immunotherapy — 1 in 11,111 Acrylamide & cancer — 1 in 16,667 Bus crash — 1 in 100,000 Plane crash — 1 in 58,824 Child pedestrian (residential) — 1 in 45,455 Railroad crossing death — 1 in 20,704 Child bike trailer — 1 in 14,286 Acid attack — 1 in 89,286 Terrorism — 1 in 77,519 Child stranger abduction — 1 in 38,760 Stranger kidnapping — 1 in 35,211 Dowry death — 1 in 13,158 Accidental gun death — 1 in 11,299 Wildfire — 1 in 100,000 Tornado — 1 in 80,645 Tsunami — 1 in 52,632 Ocean drowning — 1 in 29,155 Flood — 1 in 20,202 Landslide death — 1 in 18,416 Supervolcano eruption — 1 in 12,376 Crocodile attack — 1 in 84,746 Bee sting — 1 in 78,927 Fatal scorpion sting — 1 in 26,110 Plastic container leaching — 1 in 16,949 Infant in car seat — 1 in 64,935 Bouncer chair fall — 1 in 60,606 Toddler choking — 1 in 50,000 Unsupervised infant choking — 1 in 50,000 Magnet ingestion — 1 in 12,048 Snorkeling death — 1 in 21,739 Pet in transport — 1 in 20,000 Landmine or UXO injury — 1 in 14,728 Vaccine reaction — 1 in 763,359 Aluminum & Alzheimer's — 1 in 169,492 Residential gas leak — 1 in 140,845 Child hot car death — 1 in 102,041 Glyphosate & cancer — 1 in 1,000,000 Teflon cookware cancer — 1 in 169,492 Roller coaster injury — 1 in 312,500 Cruise ship accident — 1 in 188,679 Ferry sinking — 1 in 133,333 Turbulence injury — 1 in 114,943 School shooting — 1 in 192,308 Mass shooting — 1 in 113,636 Nuclear accident — 1 in 833,333 Avalanche — 1 in 210,526 Lightning — 1 in 209,205 Snake bite — 1 in 884,956 Spider bite — 1 in 833,333 Hippo attack — 1 in 564,972 Dog bite — 1 in 142,045 Pesticide residue — 1 in 1,000,000 Dirty can illness — 1 in 200,000 PLA bioplastic harm — 1 in 169,492 Charger left plugged in — 1 in 200,000 Infant swing death — 1 in 714,286 Child blind cord strangulation — 1 in 416,667 Child plastic bag suffocation — 1 in 263,158 Button battery — 1 in 250,000 Inclined sleeper death — 1 in 238,095 Elevator/escalator death — 1 in 188,324 Japanese encephalitis (travel) — 1 in 2,000,000 Kid + front airbag — 1 in 10,000,000 Asteroid impact — 1 in 1,351,351 Banana spider eggs — 1 in 10,000,000 Shark attack — 1 in 5,681,818 Bear attack — 1 in 3,787,879 Wild berry poisoning — 1 in 2,222,222 Space debris hits property — 1 in 10,000,000 Piranha attack — 1 in 135,135,135 Phone at gas pump — 1 in 1,000,000,000 Phone on plane — 1 in 1,000,000,000 Alien contact — 1 in 169,491,525
Lottery jackpot 1 in 95,238