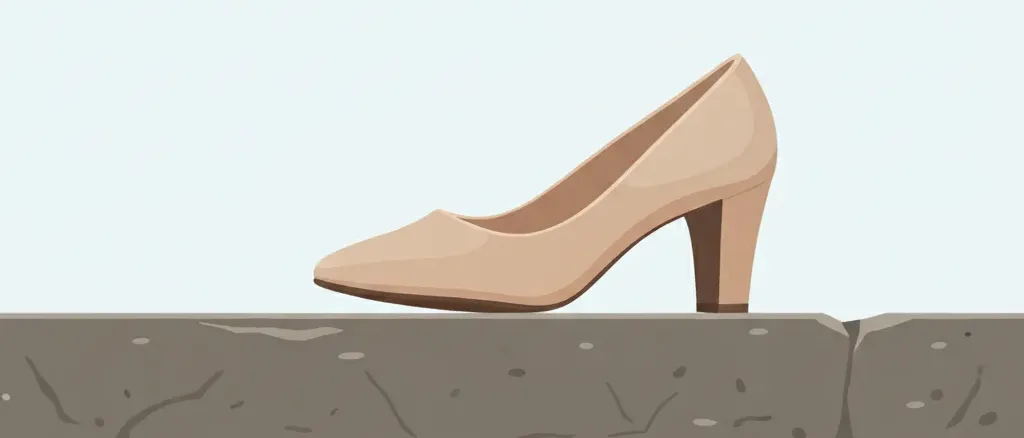
What are the odds of an emergency-room visit from a high-heel-related injury over a lifetime of wearing heels?
Evidence quality 4.88/5
Eight-dimension review score against the quality rubric . Each dimension scored 1–5.
- D1 Source grounding
- 5/5
- D2 Source authority
- 5/5
- D3 Arithmetic
- 5/5
- D4 Uncertainty
- 4/5
- D5 Scope
- 5/5
- D6 Prose
- 5/5
- D7 Perception honesty
- 5/5
- D8 Caveat completeness
- 5/5
Lifetime probability · lifetime, subgroup
1 in 79
1.3% lifetime chance
Most people underestimate this.
range 1 in 167 to 1 in 50
● your factors — click this risk ▾ to reveal
≈ As likely as
Perceived
The folk model of high-heel risk is chronic and cosmetic: bunions, Morton's neuroma, a sore lower back, eventually maybe a podiatrist. Acute, hospital-visit-grade injury on a single night out is not typically what most heel wearers consciously weigh. Women who wear heels regularly have almost all rolled an ankle or scraped a heel at some point and counted it as a near-miss. There is no good survey isolating the perceived probability of an ER visit specifically attributable to heels, so we mark this as editorial intuition. The interesting property of the fear is that the acute rate is roughly what the chronic-foot-pain rate would predict if you assumed a small fraction of bad steps reached an ER — but very few wearers carry that as the headline risk in their head.
Rough estimate: Most heel wearers would guess the lifetime ER-visit risk at well under 1 in 1,000
Source: editorial intuition, not polled
Actual
~16,000 ED visits/year among ~50 million US women who regularly wear heels (~1 in 3,100/year)
US adult women who regularly wear high-heeled shoes
Avg. lifetime encounters: ~59 (1/yr × 59 yr)
Show derivation
Scope is subgroup_lifetime: US adult women who regularly wear high-heeled shoes across an approximate 40-year heel-wearing window (roughly ages 18 to 58). Starting from a per-year baseline of approximately 16,000 ED visits attributed to high-heel- related injury (Cohen 2022, pre-pandemic 2016 to 2019 average for women aged 15 to 69) and a US heel-wearer base of approximately 50 million (about 130 million US adult women times the APMA 2014 estimate that roughly 49 percent wear heels, rounded down to account for "wear" not being operationalised by frequency), the per-wearer annual risk is roughly 1 in 3,125. Compounded across 40 years: 1 minus (1 minus 1/3125) to the 40th power equals approximately 0.0127, or about 1 in 79. The uncertainty band is wide on both sides because (a) the wearer-prevalence number is a single trade- association survey with no frequency cut, and (b) the NEISS narrative filter is a known undercount — many sprains caused by heels never mention heels in the chart note. The headline is therefore better read as a lower bound on "heel-attributable acute injury serious enough to be medically attended" rather than the full burden.
Caveats: Three structural uncertainties make this entry's number a lower bound. First, th…
Three structural uncertainties make this entry's number a lower bound. First, the NEISS narrative filter that produces the 16,000 per year figure captures only ED visits where the discharge or triage narrative explicitly names "high heel" or a close synonym — sprains caused by heels but coded only as "fall" or "ankle injury" are missed. Second, the wearer base of approximately 50 million is anchored on a single 2014 APMA survey that does not distinguish daily wearers from women who own a pair worn twice a year; the true denominator for the "at-risk" population could be half this size, in which case the per-wearer rate (and the cumulative lifetime figure) is roughly double. Third, "high heel" is itself a broad category — stiletto versus block heel versus 2-inch pump have meaningfully different fall and sprain rates, but no national surveillance system separates them. The headline is best read as "any acute injury attributed to a high-heeled shoe and serious enough to be medically attended" rather than the full burden of heel-related musculoskeletal harm, which includes chronic foot pain, Morton's neuroma, and bunion surgery that this page does not cover. The cumulative figure also excludes the much larger number of falls that happen in heels but are reported simply as falls. The fear's gap is in the other direction from many entries on this site: the acute headline (~1 in 80 lifetime ED visit) is *higher* than most heel wearers would intuit, while the catastrophic-outcome version of the fear (heel fall causing serious head injury or death) is genuinely rare.
Regional breakdown
The headline figure averages across very different populations. Here’s how the probability varies by geography or context:
| Region / context | Lifetime probability | Notes |
|---|---|---|
| Per year (US heel-wearing woman, 2016 to 2019 baseline) | 1 in 3,125 |
Cohen 2022 pre-pandemic figure: ~16,000 ED visits / ~50M heel-wearers. Roughly 1 in 3,100 per year. Drops to about 1 in 8,000 per year in 2020 under pandemic conditions. |
| Per year, ages 20 to 29 (US heel-wearing woman) | 1 in 1,250 |
Moore 2015 reports 18.38 per 100,000 women in this age band, roughly 2.5x the all-female average. Heel use is concentrated in this group and the rate scales accordingly. |
| Per year, ages 50+ (US heel-wearing woman) | 1 in 10,000 |
Order-of-magnitude estimate. Moore 2015 shows steep age decline after 40; heel use drops sharply and so does the absolute rate. Population at risk is much smaller, so per-wearer risk does not fall by the same factor. |
| Per 40-year heel-wearing career (cumulative) | 1 in 79 |
Headline subgroup_lifetime figure: about 1 in 80 women who wear heels regularly across their adult life will visit an ED with a heel-attributed injury at least once. |
Risks at similar odds
Other risks with roughly the same likelihood — useful for calibration.


Benzo dependence
What are the odds of developing benzodiazepine dependence after a standard prescription?


Cat litter toxoplasmosis
What are the odds of acquiring a toxoplasma infection from cleaning a cat's litter box?


Recently viewed on this device
Stored locally — clear anytime.
Pick challenger
The useful number is the one per heel-wearing year, not the headline lifetime figure. A US woman who regularly wears heels has roughly a 1 in 3,100 chance per year of an ED visit attributed to her shoes — about 16,000 such visits a year across the roughly 50 million US heel wearers, per the Cohen (2022) extension of the Moore (2015) NEISS series. Compounded across a 40-year heel-wearing adult life, that becomes about 1 in 80. The peak age band is 20 to 29 at roughly 2.5 times the average rate, where heel height, frequency of wear, and the at-risk contexts (clubs, weddings, unfamiliar venues) all stack. Most of the injuries are sprains and strains to the foot and ankle, with about one in five being fractures.
What is interesting about this fear is the direction of the perceived-versus-actual gap. The chronic, cosmetic harms of heels — bunions, back pain, podiatry visits — are the version most wearers carry in their head, and they are well-understood. The acute, hospital-visit-grade harm is less salient: most women have rolled an ankle in heels at some point and counted it as a near-miss rather than the upper tail of the same distribution that produces 16,000 ED visits a year. The Moore series also documented that the rate roughly doubled between 2002 and 2012, in a period when neither US adult female population nor the share of women wearing heels obviously doubled — most likely a mix of higher heels coming back into fashion and more attentive coding at sentinel NEISS hospitals.
The headline figure is meaningfully heterogeneous. A daily heel wearer in a workplace dress code accumulates roughly five times the exposure of an occasional wearer, and per-year rate scales with exposure approximately linearly. Alcohol substantially elevates per-event risk: the NEISS narrative often flags evening events even though the surveillance system does not code intoxication directly. After about age 50, both the share of women wearing heels and the absolute ED visit rate drop steeply, though the case-fatality of a fall from a heel rises with age in line with the broader geriatric-fall literature. And the number itself is best read as a lower bound: NEISS captures only injuries whose discharge note names the shoe, and a meaningful share of heel-attributable sprains and falls reach the ED coded only as “fall” or “ankle injury.”
Claim ledger
Every number below is what each source reported, with the verbatim quote we relied on and how we arrived at our figure. Click any link to verify directly.
-
[1] Journal of Foot and Ankle Surgery (Moore JX, Lambert B, Jenkins GP, McGwin G Jr) — Epidemiology of High-Heel Shoe Injuries in U.S. Women: 2002 to 2012
Epidemiology of High-Heel Shoe Injuries in U.S. Women: 2002 to 2012- Statistic
123,355 estimated ED visits over 11 years (2002 to 2012); overall rate 7.32 per 100,000 females (95% CI 7.08 to 7.56); rate roughly doubled across the period; ages 20 to 29 highest at 18.38 per 100,000, ages 30 to 39 at 11.07 per 100,000; over 80 percent foot or ankle injuries; ~19 percent fractures; 49.5 percent of injuries occurred at home- Excerpt
“"A total of 3294 injuries, representing an estimated 123,355 high-heel-related injuries, were treated in emergency departments within the United States from 2002 to 2012." [Paraphrase from abstract — full text paywalled] "The overall rate of high-heel-related injuries was 7.32 per 100,000 females (95% confidence interval 7.08 to 7.56)." "Our results suggest that high-heel-related injuries have nearly doubled during the 11-year period from 2002 to 2012." "Most injuries occurring as sprains and strains to the foot and ankle." ”
- Source data from
- 2015-07-01
- Accessed
- 2026-05-28 · archived copy
- Calculation
- Moore et al. is the foundational US epidemiology of acute high-heel injury, built on a NEISS narrative search across 100 US sentinel emergency departments 2002 to 2012. Two figures anchor this page: the long-run all-female rate of 7.32 per 100,000 (used as the floor of the per-year-per-woman range, not the per- wearer rate), and the age-banding (ages 20 to 29 at 2.5 times the average rate), which drives the personal factor multipliers below. The paper's 123,355 / 11 = ~11,200 ED visits per year average is *lower* than Cohen 2022's 2016 to 2019 figure (~16,000) because the rate was rising across the Moore window — the headline calculation uses Cohen's more recent baseline, with Moore's older figure setting the low end of the uncertainty band.
- Independence
- Both Moore 2015 and Cohen 2022 use the same NEISS national surveillance system, so they are method-correlated, not fully independent measurements. The two are cited together because they cover non-overlapping time windows (2002 to 2012 vs 2016 to 2020) and Cohen explicitly extends Moore's series.
-
[2] Social Determinants of Health (Cohen PN, University of Maryland) — Pandemic-related decline in injuries related to women wearing high-heeled shoes: Analysis of U.S. data for 2016 to 2020
Pandemic-related decline in injuries related to women wearing high-heeled shoes: Analysis of U.S. data for 2016 to 2020- Statistic
2016 to 2019 baseline approximately 16,000 ED visits per year among US women aged 15 to 69; 2020 dropped to 6,290 visits (5.40 per 100,000, 95% CI 3.95 to 6.86) after COVID shutdowns; no significant change in fracture share or hospital-admission share- Excerpt
“"There were an estimated 6,290 high-heel related emergency department visits involving women ages 15 to 69 in 2020, compared with approximately 16,000 per year in 2016 to 2019." "The 2020 rate of 5.40 HHSRIs per 100,000 women ages 15 to 69 was significantly below the peak in 2017." ”
- Source data from
- 2022-01-01
- Accessed
- 2026-05-28 · archived copy
- Calculation
- Cohen 2022 provides the most current pre-pandemic baseline (~16,000 ED visits per year), which we use as the numerator for the headline calculation. The 2020 pandemic figure (6,290) is informative but suppressed by behaviour change — most women were not commuting in heels in 2020 and we treat that year as not representative of a steady-state denominator. Using 16,000 / 50 million heel- wearing women equals roughly 1 in 3,125 per year, which compounds over 40 years to approximately 1 in 79. If the pre-pandemic 16,000 is replaced by Moore's older 11,000 (still inside the same NEISS series), the per-year rate becomes 1 in 4,545 and the 40-year cumulative is approximately 1 in 113 — this is the low end of our uncertainty band.
- Independence
- Shares the NEISS surveillance backbone with Moore 2015. Treat as a temporal extension and methodological cross-check, not an independent measurement.
-
[3] American Podiatric Medical Association (APMA), via PR Newswire — New Study Shows High Heels are Biggest Culprit of Female Foot Pain
New Study Shows High Heels are Biggest Culprit of Female Foot Pain- Statistic
Nearly half of US adult women (49 percent) wear high heels; 71 percent of heel wearers report the shoes hurt their feet; survey of 1,000 US adults aged 18 and over (2014)- Excerpt
“"Nearly half of all women (49 percent) wear high heels, even though the majority of heel wearers (71 percent) complain these shoes hurt their feet." "The study, which surveyed 1,000 US adults ages 18 and older..." ”
- Source data from
- 2014-05-19
- Accessed
- 2026-05-28 · archived copy
- Calculation
- The APMA survey is the denominator anchor for the per-wearer calculation: approximately 130 million US adult women times 49 percent equals roughly 64 million heel wearers. We round down to 50 million in the headline because "wear high heels" in APMA's survey is not operationalised by frequency — a respondent who owns heels and wears them twice a year answers yes, and they are not really the population the per-year ED-visit denominator should be built from. The 30 to 50 percent prevalence range maps directly into the uncertainty band: at 30 percent prevalence the per-wearer annual rate would be roughly 1 in 2,400, giving a 40-year cumulative of approximately 1 in 60 (high end of the band).
- Independence
- Independent of NEISS — different research design, different question, different population. Trade-association survey is the weakest of the three sources on method, but no peer-reviewed prevalence study with a frequency cut exists.
-
[4] Sports Medicine (Doherty C, Delahunt E, Caulfield B, Hertel J, Ryan J, Bleakley C) — The Incidence and Prevalence of Ankle Sprain Injury: A Systematic Review and Meta-Analysis of Prospective Epidemiological Studies
The Incidence and Prevalence of Ankle Sprain Injury: A Systematic Review and Meta-Analysis of Prospective Epidemiological Studies- Statistic
Pooled ankle sprain incidence 13.6 per 1,000 exposures in females vs 6.94 per 1,000 in males across prospective studies; ankle sprain is one of the most common musculoskeletal injuries- Excerpt
“"A higher incidence of ankle sprain in females compared with males (13.6 vs 6.94 per 1,000 exposures), in children compared with adolescents (2.85 vs 1.94 per 1,000 exposures)." [Paraphrase from abstract — full text paywalled] ”
- Source data from
- 2014-01-01
- Accessed
- 2026-05-28 · archived copy
- Calculation
- Doherty et al. is not a high-heel study; it is the meta-analytic anchor for the background female-vs-male ankle-sprain rate ratio (roughly 2x). Used here only as context for the personal factor multipliers and to underline that the heel- attributable ED-visit count is one slice of the much larger female ankle-sprain burden — most sprains, including some caused by heels, never reach an ED at all. We do not derive any headline number from this source.
- Independence
- Independent of NEISS, independent of the APMA survey. Cited as method context, not as a per-wearer rate measurement.