Evidence quality 4.6/5
Eight-dimension review score against the quality rubric . Each dimension scored 1–5.
- D1 Source grounding
- 5/5
- D2 Source authority
- 5/5
- D3 Arithmetic
- 4/5
- D4 Uncertainty
- 4/5
- D5 Scope
- 5/5
- D6 Prose
- 5/5
- D7 Perception honesty
- 4/5
- D8 Caveat completeness
- 5/5
● your factors — click this risk ▾ to reveal
- Your factors
≈ As likely as
Perceived
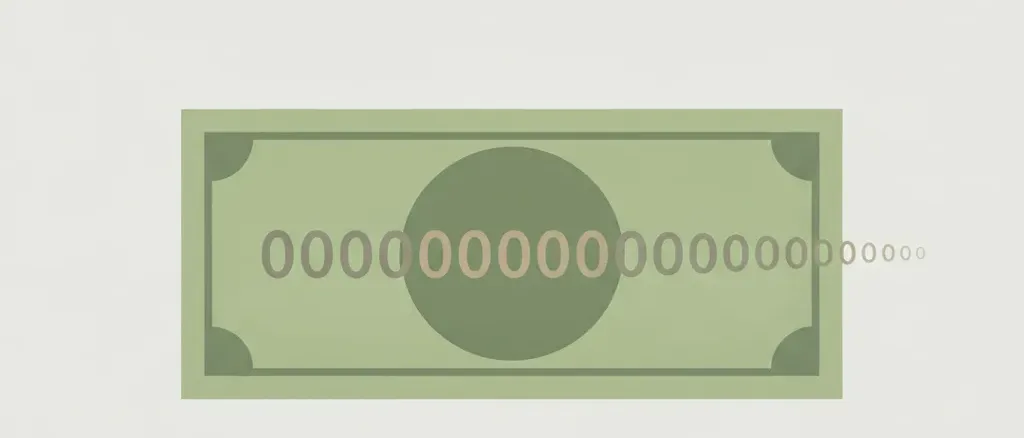
For readers in reserve-currency economies, currency collapse is the canonical "happens to other people" risk. The mental image is fixed and historical: Weimar wheelbarrows of marks, a Zimbabwean hundred-trillion-dollar note, a Venezuelan shop re-pricing twice a day. Because those images are extreme and foreign, the typical US, eurozone, or Japanese adult treats the event as a museum piece — vanishingly rare, confined to failed states and lost wars. That intuition is well calibrated for their own currency and badly calibrated as a statement about the world: at the global level, a substantial minority of adults alive today have personally lived through an inflation crisis, and in Latin America, Sub-Saharan Africa, and the former Soviet bloc it is closer to a generational rite of passage than a freak event. The Chapman Survey of American Fears does not isolate currency collapse, but "economic/financial collapse" recurs in its top ten, suggesting the dread exists even where the personal probability is near zero.
Rough estimate: Most reserve-currency adults treat it as a once-a-century freak event; globally it is closer to a once-a-generation regional regularity
Source: editorial intuition, not polled
Actual
25 of 133 market economies experienced a very-high-inflation episode (>100%/yr) between 1960 and 1996 (Fischer, Sahay & Vegh, JEL 2002)
133 market economies in the IMF sample
Show derivation
This is a population-weighted global-adult estimate, not a country-count rate, and not a US-adult rate. The distinction matters more here than for almost any other entry on the site, because inflation crises are extraordinarily concentrated. They are not sprinkled uniformly across countries: a persistent subset of chronic-inflation economies returns to crisis repeatedly (Argentina spent over seventeen years above 100%/yr in the Fischer et al. sample, Brazil over fifteen, the Democratic Republic of the Congo had six separate episodes totalling fifteen years), while reserve-currency and large low-inflation economies essentially never cross the threshold in a living adult's lifetime. The right model is therefore not a uniform per-country hazard compounded over 59 years, but a population partition: lifetime exposure is approximately 1 for an adult in a chronic / crisis-prone economy and approximately 0 for an adult in a low-inflation giant. The threshold must be applied symmetrically to every country, which is the crux. The question asks specifically about a systemic monetary-order failure — hyperinflation, or an outright currency collapse — not an ordinary high-inflation year, so the operational line is "sustained very-high inflation / monetary-order failure" rather than the broad Reinhart-Rogoff >=20%/yr inflation-crisis line. Under that strict reading the in-bucket population is roughly: most of Latin America and the Caribbean (~663M, ~8% of world population — Argentina, Brazil, Bolivia, Peru, Venezuela and others), the chronic / very-high-inflation subset of Sub-Saharan Africa (Fischer et al. name nine African countries with >100%/yr episodes — Angola, the DRC, Ghana, Guinea-Bissau, Sierra Leone, Somalia, Sudan, Uganda, Zambia — plus Zimbabwe; on the order of 5-7% of world population, NOT all 16% of SSA), the former Soviet bloc (~300M, ~4% — the entire bloc ran inflation above 100%/yr in 1992-94), plus chronic cases outside those blocs (Turkey, Iran, Lebanon, Myanmar, Suriname; roughly 2-3%). Crucially, China and India are OUT under this strict reading: China's last hyperinflation was 1947-49 and India has never crossed ~100%/yr, and excluding them is only consistent because SSA is counted as the named high-inflation subset rather than the whole region. Summing the in-bucket population shares gives roughly 18% of global adults, or ~1 in 5.5 — consistent with the native rate (25 of 133 market economies, ~19%). The uncertainty band reflects the threshold choice, which is the dominant lever: restricting to true Cagan hyperinflation alone (>=50%/month) pulls the figure toward ~0.10; broadening to any >=20%/yr inflation-crisis year would pull China (~24% in 1994), India (~28% in the mid-1970s oil shock), Indonesia and much of South/Southeast Asia into the bucket and push the figure above ~0.35. The point estimate sits at the strict monetary-order-failure reading the question specifies.
Caveats: The headline ~1 in 5.5 is a GLOBAL-adult, lifetime figure and is dominated by on…
The headline ~1 in 5.5 is a GLOBAL-adult, lifetime figure and is dominated by one modelling choice and one definitional choice. The modelling choice: inflation crises are concentrated, not uniform, so the figure is built by partitioning the world's population into a high-exposure bucket (lifetime probability ~1) and a near-zero bucket, then summing population shares — not by compounding a single per-country hazard. The definitional choice: "currency collapse or hyperinflation" has no single agreed threshold, and the threshold MUST be applied symmetrically to every country or the figure becomes incoherent. True Cagan hyperinflation (>=50%/month) is genuinely rare — 57 verified episodes worldwide since the 1790s in the Hanke-Krus table, with none at all between 1947 and 1984. The central estimate uses the strict "systemic monetary-order failure" reading the question specifies — sustained very-high inflation up through hyperinflation — which keeps the low-inflation giants China and India out of the bucket and counts Sub-Saharan Africa as its named high-inflation subset rather than the whole region. That reading lands at ~1 in 5.5 and agrees with the country rate (25 of 133, ~19%). Restricting all the way to true Cagan hyperinflation pulls the figure toward the lower bound (~0.10); broadening to the looser Reinhart-Rogoff inflation-crisis line (>=20%/yr) pulls China (~24% in 1994), India (~28% in the mid-1970s) and much of South and Southeast Asia into the bucket and pushes it toward the upper bound (~0.35). The US-versus-global gap is the key caveat: a US, eurozone, or Japanese adult's personal lifetime probability is near zero (the reserve-currency multiplier of 0.05 reflects this), while a Latin American, Sub-Saharan African, or post-Soviet adult's is close to certain. The figure also measures living through the event, not suffering proportional wealth loss — the standard event-versus-severity distinction. Holding hard currency or hard assets is the documented hedge and is captured as a protective multiplier, not as a change to the macro probability. The estimate treats post-2000 quiescence cautiously: Reinhart & Rogoff explicitly warn that quiet periods in inflation, as in default, do not extend indefinitely, and Venezuela's 2016 entry into the hyperinflation record book within a decade of the book's publication is a live example. The dread also runs the other way, and that direction has no base rate. A separate strand of forecasting — most loudly Elon Musk's 2026 prediction that AI- and robotics-driven abundance will make money "irrelevant" by the mid-2030s — imagines the monetary order dissolving through deflation and post-scarcity rather than through inflation. That is a speculative forecast, not a measured frequency: it has no historical episode base, so it is deliberately excluded from the figure above and carries no number here. It is flagged only so the absence of a deflation-side estimate is not read as a claim that a currency can fail only by losing its value, never by losing its purpose.
Related risks
Other risks on similar themes — for exploring related fears.

Extremist govt catastrophe
What are the odds of a political extremist government catastrophically ruining your country?

Prolonged grid blackout
What are the odds of living through a prolonged power-grid blackout lasting days or longer?





Pick challenger
This entry deliberately carves out a narrow event: a systemic failure of the monetary order — hyperinflation in the strict sense (the Cagan threshold of prices rising more than 50 percent in a single month) or an outright currency collapse, where a sustained inflation crisis and an exchange-rate crash destroy the value of the unit of account. That is a different animal from an ordinary recession (near-certain over any adult lifetime, see economic-recession-impact) or an equity-market crash (also near-certain, see stock-market-crash). Those are downturns within a functioning monetary system; this is the system itself breaking. The strict tail is genuinely rare: the Hanke-Krus World Hyperinflation Table catalogues only 56 verified hyperinflations worldwide since revolutionary France in the 1790s — Venezuela became the 57th in 2016 — and Fischer, Sahay and Vegh note there were no hyperinflations at all between 1947 and 1984. The worst ever measured was Hungary in July 1946, when prices doubled roughly every fifteen hours.
The number that makes this entry worth publishing is not the rarity of the extreme tail but the frequency of the broader event once you count the whole world rather than one currency. Using the Reinhart and Rogoff threshold for an inflation crisis — annual inflation of 20 percent or more, which they show travels “hand-in-hand” with exchange-rate crashes — the picture changes. Fischer and colleagues found that 25 of 133 market economies suffered an episode above 100 percent a year between 1960 and 1996, with most of those clustered in Latin America (twelve countries) and Africa (nine). Reinhart and Rogoff, working from eight centuries of price data across sixty-six countries, put it more bluntly: no emerging-market country in history has escaped bouts of high inflation, and in their modern table only New Zealand and Panama show no year of inflation above 20 percent. Weight those facts by where people actually live — counting the chronic and very-high-inflation economies of Latin America, the named high-inflation countries of Sub-Saharan Africa, the former Soviet bloc, and cases like Turkey and Iran, while keeping the low-inflation giants China and India out — and roughly one in five of the world’s adults has lived through, or will live through, a currency collapse. That is the basis for the ~1 in 5.5 headline, and it lines up with the 25-of-133 (about 19 percent) country rate. Push the threshold down to the broader 20-percent inflation-crisis line and China (about 24 percent in 1994) and India (about 28 percent in the mid-1970s oil shock) come into the count, lifting the figure above one in three; that ambiguity, not statistical noise, is what the uncertainty band measures.
Almost all of the interest in this number is in how unevenly it is distributed, which is why the figure is normalized as a global-adult rather than a US-adult probability. Inflation crises are not sprinkled randomly; they recur in a persistent subset of economies and almost never touch the rest. Argentina spent more than seventeen years above 100 percent inflation in the Fischer sample; the Democratic Republic of the Congo had six separate episodes. Against that, a reserve-currency adult — in the United States, the eurozone, or Japan — has a personal lifetime probability close to zero (the US last exceeded 20 percent inflation during the 1860s Civil War), and China and India, together more than a third of humanity, sit in the low-exposure bucket as well. The result is a fear that is simultaneously overrated and underrated: overrated as a personal threat by the Western reader who pictures Weimar and assumes it could happen anywhere, and underrated as a global regularity by the same reader, for whom “about one in five living adults has seen their currency collapse” reads as implausible until the population weighting is laid out. The documented hedge — holding hard currency or hard assets — changes the damage, not the odds.
Related tidbits
About 1 in 5 of the world's adults will live through a currency collapse or hyperinflation, but the risk is wildly uneven. For a US, eurozone, or Japanese adult it is near zero; for a Latin-American, post-Soviet, or high-inflation-African adult it is closer to a near-certainty.
Claim ledger
Every number below is what each source reported, with the verbatim quote we relied on and how we arrived at our figure. Click any link to verify directly.
2/4 sources independently verified verbatim against the cited source
-
[1] National Bureau of Economic Research / Stanley Fischer, Ratna Sahay, Carlos A. Vegh (also Journal of Economic Literature 40(3), 2002) — Modern Hyper- and High Inflations
Modern Hyper- and High Inflations- Statistic
Following Cagan (1956), hyperinflation begins the month inflation first exceeds 50% per month; between 1947 and 1984 there were no hyperinflations, and since 1984 at least seven (in six countries); 45 very-high-inflation episodes (>100%/yr) in 25 countries; as many as 25 of 133 market economies have had a very-high-inflation episode- Excerpt
“"Cagan defined a hyperinflation as beginning in the month inflation first exceeds 50 percent (per month) and as ending in the month before the monthly inflation rate drops below 50 percent for at least a year. [...] Between 1947 and 1984 there were no hyperinflations. Since 1984, there have been at least seven (in six countries) in the market economies [...] since 1960, most countries have suffered from at least one episode of inflation of more than 25 percent per annum, and as many as 25 (out of 133) market economies have experienced an episode of very high inflation (i.e., twelve-month inflation above 100 percent)." ”
- Source data from
- 2002-05-01
- Accessed
- 2026-06-21 · archived copy
- Calculation
- Fischer, Sahay & Vegh provide the cleanest cross-country base rate. The native figure uses their headline count: 25 of 133 market economies experienced an episode above 100%/yr over roughly 1960-1996. This is a share of COUNTRIES, not of people. It is used as the native rate (25/133 ~= 19% of market economies), and as the anchor for the lower end of the population-weighted band, because true hyperinflation and >100%/yr inflation are rarer than the broader 20-40%/yr "currency collapse" events that the headline normalized figure counts. The Cagan 50%/month definition fixes the upper (hyperinflation) tail; the "no hyperinflations 1947-1984, then seven since 1984" sentence establishes that true hyperinflation is a handful of episodes per generation, concentrated in a few countries.
- Independence
- Methodologically independent of Reinhart & Rogoff: Fischer et al. use IMF International Financial Statistics monthly price data and Cagan-style episode dating on a 133-country market-economy sample, whereas Reinhart & Rogoff build an eight-century annual cross-country inflation database. The two converge on the same qualitative picture from different data.
-
[2] National Bureau of Economic Research / Carmen M. Reinhart, Kenneth S. Rogoff — This Time Is Different: A Panoramic View of Eight Centuries of Financial Crises
This Time Is Different: A Panoramic View of Eight Centuries of Financial Crises- Statistic
Inflation crisis defined as annual inflation >=20%; no emerging-market country in history (including the US in the 1860s) has escaped bouts of high inflation; across 66 countries inflation crises and exchange-rate crashes travel hand in hand- Excerpt
“"If serial default is the norm for a country passing through the emerging market state of development, then the tendency to lapse into periods of high and extremely high inflation is an even more striking common denominator. No emerging market country in history, including the United States (whose inflation rate exceeded 20 percent during the country's 1860s civil war) has managed to escape bouts of high inflation. [...] inflation crises and exchange rate crises travel hand-in-hand in the overwhelming majority of episodes across time and countries." ”
- Source data from
- 2008-03-01
- Accessed
- 2026-06-21 · archived copy
- Calculation
- Reinhart & Rogoff supply the operational threshold for the broad "currency collapse" framing: an inflation crisis is a year with annual inflation >=20%, and they show inflation crises and exchange-rate crashes co-occur in the overwhelming majority of episodes — i.e. an inflation crisis IS, in practice, a currency collapse. Their 66-country eight-century database documents that essentially every emerging-market economy has had at least one such episode, while only a short list of countries (notably New Zealand and Panama in their Table 13) show no period of inflation over 20%. This supports the population-partition method: the in-bucket population share is approximated by the emerging-market / chronic-inflation regions, against an out-bucket of reserve-currency economies plus China and India.
- Independence
- Independent annual cross-country price database (consumer-price and cost-of-living indices back to the 1700s-1800s for many countries), distinct from the IMF monthly-data approach in Fischer et al. Reinhart & Rogoff cite Fischer, Sahay & Vegh only for the African high-inflation analysis, not for the crisis-dating used here.
-
[3] Cato Institute / Steve H. Hanke and Nicholas Krus (Johns Hopkins Institute for Applied Economics) — World Inflation and Hyperinflation Table Verified
World Inflation and Hyperinflation Table- Statistic
The Hanke-Krus World Hyperinflation Table documents all 56 documented episodes of hyperinflation since the 1790s; Venezuela was added in 2016 as the 57th verified episode- Excerpt
“"This chapter supplies, for the first time, a table that contains all 56 episodes of hyperinflation, including several which had previously gone unreported." ”
- Source data from
- 2017-01-01
- Accessed
- 2026-06-21 · archived copy
- Verification
- Excerpt independently re-fetched and confirmed word-for-word against the cited source during our grounding audit.
- Calculation
- The Hanke-Krus table is the definitive catalogue of true (Cagan-threshold, >=50%/month) hyperinflation. Fifty-six episodes since the assignat inflation of revolutionary France (1795-96), with Venezuela added as the 57th in 2016, across well over two centuries and the whole world, is the headline rarity fact: true hyperinflation is roughly one verified episode every four years globally, heavily clustered around wars, revolutions, the collapse of empires, and the births of new states (the post-WWI European cluster, the post-Soviet 1992-94 cluster). This source bounds the EXTREME tail of the distribution and is why the normalized figure is driven by the broader 20-40%/yr currency-collapse band rather than by the much rarer hyperinflation band alone.
- Independence
- Independent episode catalogue compiled from primary price data by Hanke and Krus, distinct from both the IMF (Fischer et al.) and the Reinhart-Rogoff databases. Uses the strict Cagan monthly-rate definition.
-
[4] Guinness World Records — Highest inflation rate (ever) Verified
Highest inflation rate (ever)- Statistic
The highest recorded inflation occurred in Hungary in July 1946: a daily inflation rate of 207%, with prices doubling roughly every 15 hours- Excerpt
“"The highest recorded rate of inflation occurred in Hungary during July 1946. [...] This works out to a daily inflation rate of 207%, meaning that prices denominated in Hungarian pengo doubled every 15 hours." ”
- Source data from
- 2024-01-01
- Accessed
- 2026-06-21 · archived copy
- Verification
- Excerpt independently re-fetched and confirmed word-for-word against the cited source during our grounding audit.
- Calculation
- Used only as the illustrative ceiling of the distribution — the single worst monthly/daily inflation rate ever measured. It anchors the "how bad can it get" end of the prose and is not used in the probability arithmetic. Hungary's August 1946 forint reset (replacing the pengo at a rate on the order of 4 x 10^29 to 1) is the canonical example of a complete monetary-order collapse and currency replacement.
- Independence
- Record-keeping reference; the Hungary 1946 figure is independently reported by the Hanke-Krus table, Cagan (1956), and Fischer et al., so the illustrative fact is well corroborated.