What are the odds of experiencing a major stock market crash (>30% decline) in your lifetime?
Evidence quality 4.75/5
Eight-dimension review score against the quality rubric . Each dimension scored 1–5.
- D1 Source grounding
- 5/5
- D2 Source authority
- 4/5
- D3 Arithmetic
- 5/5
- D4 Uncertainty
- 5/5
- D5 Scope
- 5/5
- D6 Prose
- 5/5
- D7 Perception honesty
- 4/5
- D8 Caveat completeness
- 5/5
Lifetime probability · lifetime, US adult
1 in 1.0
99% lifetime chance
range 1 in 1.1 to 1 in 1.0
● your factors — click this risk ▾ to reveal
≈ As likely as
Perceived
Stock market crashes occupy a unique psychological niche: everyone knows they happen, most people dread them, but few appreciate how routine they are. Gallup's annual Economy and Personal Finance survey consistently finds that roughly one in three US adults cite a stock market crash as a major financial worry, putting it alongside job loss and medical debt. The Chapman Survey of American Fears does not list market crashes as a standalone item, but "economic/financial collapse" routinely ranks among the top ten fears, suggesting that the anxiety attaches less to the statistical frequency of crashes and more to the narrative of sudden, irreversible ruin.
Rough estimate: most people treat a severe crash as a once-in-a-generation shock, not a once-a-decade regularity
Source: editorial intuition, not polled
Actual
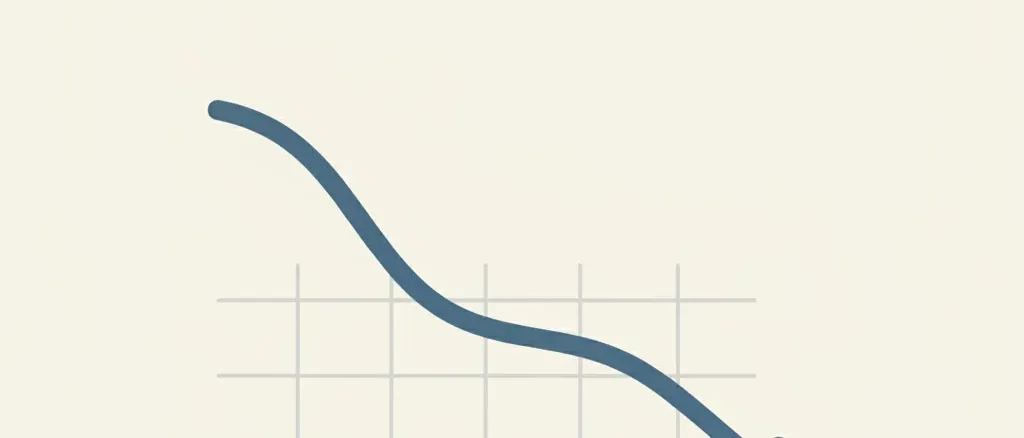
~8 declines >30% in ~96 years of S&P 500 history (1929-2025)
S&P 500 index history
Show derivation
Since 1929 the S&P 500 has experienced roughly 8 peak-to-trough declines exceeding 30%: 1929-32 (-86%), 1937-38 (-54%), 1968-70 (-36%), 1973-74 (-48%), 1987 (-34%), 2000-02 (-49%), 2007-09 (-57%), and 2020 (-34%). That is approximately one every 12 years on average. Over a 40-year investment career the probability of experiencing at least one such decline is 1 - (1 - 1/12)^40 ≈ 0.97. Over a full 59-year adult life the figure exceeds 0.99. The 2022 decline (-25%) and the April 2025 tariff selloff (-19% intraday peak-to-trough) both fell short of 30% but illustrate how close the market comes to the threshold regularly. The point estimate of 0.99 reflects the near-certainty that any adult with a multi-decade investment horizon will live through at least one >30% drawdown.
Caveats: The headline probability addresses whether an investor will *experience* a >30% …
The headline probability addresses whether an investor will *experience* a >30% market decline, not whether they will suffer permanent financial harm from one. The two are very different questions. The S&P 500 has recovered from every bear market in history, with an average recovery time of about 2.5 years. Permanent loss of wealth from a crash is almost exclusively a behavioral outcome (panic selling, margin liquidation, or forced withdrawal at the bottom) rather than a market outcome. The native unit here is event frequency (crashes per year of market history), not a traditional epidemiological rate, so the normalization is a Poisson-style "at least one event in N years" calculation rather than a compounding annual hazard.
Regional breakdown
The headline figure averages across very different populations. Here’s how the probability varies by geography or context:
| Region / context | Lifetime probability | Notes |
|---|---|---|
| Declines of 20-30% (correction/mild bear) | 1 in 1.0 |
~19 episodes since 1928; occurs every ~5 years on average — effectively certain over a career |
| Declines of 30-40% | 1 in 1.1 |
~4 episodes since 1928 in this band specifically (1968-70, 1987, 2020, plus several borderline) |
| Declines of 40-50% | 1 in 1.3 |
~3 episodes: 1937-38 (-54%), 1973-74 (-48%), 2000-02 (-49%) |
| Declines exceeding 50% | 1 in 2.2 |
~2 episodes: 1929-32 (-86%), 2007-09 (-57%); roughly every 45-50 years |
Risks at similar odds
Other risks with roughly the same likelihood — useful for calibration.


Career obsolescence
What are the odds of needing to change careers due to technological disruption?


Forced job exit before retirement
How likely is a worker over 50 to be pushed out of their job before they planned to retire?
Recently viewed on this device
Stored locally — clear anytime.
Pick challenger
A >30% stock market decline is one of the most statistically certain events cataloged on this site. The S&P 500 has suffered roughly eight such drawdowns since 1929 — an average of one every twelve years. Over a forty-year investment career, the probability of living through at least one approaches 97%; over a full adult lifetime it exceeds 99%. Even the milder >20% bear market, which Hartford Funds counts 27 of since 1928, arrives about every 3.6 years. If the question is “will I experience a major crash,” the honest answer is: almost certainly yes, and probably more than once.
The paradox is that this near-certain event is also one of the most survivable. Every bear market in S&P 500 history has been followed by a full recovery, with an average time to reclaim the prior peak of roughly 2.5 years. A dollar invested in the S&P 500 in 1928 — surviving the Great Depression, World War II, stagflation, Black Monday, the dot-com bust, the financial crisis, COVID, and the 2025 tariff shock — would be worth over $1.3 million today with dividends reinvested. The average annual return of roughly 10-12% (depending on arithmetic vs. geometric measurement) already includes all of those crashes. Long-run compounding does not merely tolerate periodic 30-50% drawdowns; it absorbs them entirely.
The genuine risk is not the crash itself but the investor’s reaction to it. DALBAR’s annual study of investor behavior finds that the average equity fund investor earned just 16.54% in 2024, compared with the S&P 500’s 25.05% return — an 848-basis-point gap, the second largest of the past decade. The mechanism is consistent: investors withdraw money during or just after a decline, then re-enter only after the recovery is well underway — buying high, selling low, year after year. Hartford Funds notes that 42% of the S&P 500’s strongest single days over the past twenty years occurred during bear markets. Missing those days by sitting on the sidelines is the real cost. For most people, the rational fear is not the crash on the screen but the impulse to act on it.
Related tidbits
15% of crypto investors face total loss. 20% of all Bitcoin is permanently inaccessible. Stock crashes (99% certain) have always recovered. One asset class forgives. The other forgets your password.
You will live through ~9 recessions and every major stock crash in a lifetime. Both are 99% certain. The difference: every stock crash has recovered. Recessions leave scars that compound.
If you invest for a full career, a major stock market crash is near-certain (~99% lifetime). A housing crash comparable to 2008 has about a 12% lifetime probability. One is inevitable; the other is uncommon.
Claim ledger
Every number below is what each source reported, with the verbatim quote we relied on and how we arrived at our figure. Click any link to verify directly.
-
[1] Hartford Funds — 10 Things You Should Know About Bear Markets
10 Things You Should Know About Bear MarketsSee all 2 Likelier entries citing this source →
- Statistic
There have been 27 bear markets (>20% decline) in the S&P 500 since 1928; stocks lose 35% on average in a bear market; average recovery takes about 2.5 years- Excerpt
“"There have been 27 bear markets in the S&P 500 Index since 1928. The average length of a bear market is 289 days, or about 9.6 months. Stocks lose 35% on average in a bear market. About 42% of the S&P 500 Index's strongest days in the last 20 years occurred during a bear market." ”
- Source data from
- 2025-06-01
- Accessed
- 2026-04-19 · archived copy
- Calculation
- Hartford Funds compiles S&P 500 bear market data in partnership with Ned Davis Research. Their count of 27 bear markets since 1928 yields an average frequency of one every ~3.6 years for >20% declines. The average decline of 35% confirms that the typical bear market crosses the 30% threshold. From this dataset we identify approximately 8 distinct episodes exceeding 30%, giving a frequency of roughly once every 12 years. Lifetime probability = 1 - (1 - 1/12)^59 ≈ 0.993.
-
[2] Aswath Damodaran, NYU Stern School of Business — Historical Returns on Stocks, Bonds and Bills: 1928-2024
Historical Returns on Stocks, Bonds and Bills: 1928-2024- Statistic
S&P 500 annual return data from 1928-2024; annual return averaged 11.79% with positive returns in 71 of 97 years; worst year -43.84% (1931), best year 52.56% (1954)- Excerpt
“[Raw data table of annual S&P 500 returns, Treasury bill rates, and Treasury bond returns from 1928 to 2024, with cumulative growth-of-$100 columns for each asset class. No narrative text; the table shows year-by-year returns including all crash and recovery years.] ”
- Source data from
- 2025-01-01
- Accessed
- 2026-04-19 · archived copy
- Calculation
- Damodaran's dataset is the standard academic reference for long-run US equity returns. The raw data table shows annual returns from 1928-2024, with positive returns in 71 of 97 years and an annual return averaging 11.79%. The data demonstrates that every crash in S&P 500 history has been fully recovered. This provides the denominator context: crashes are near-certain events, but long-term compounding overwhelms them for patient investors. Used to validate the "recoverable" framing rather than to compute the crash probability directly.
-
[3] DALBAR, Inc. (via PR Newswire) — Investors Missed the Best of 2024's Market Gains, Latest DALBAR Investor Behavior Report Finds
Investors Missed the Best of 2024's Market Gains, Latest DALBAR Investor Behavior Report Finds- Statistic
Average equity investor earned 16.54% in 2024 vs S&P 500 return of 25.05%; 848 basis point lag is the second-largest performance gap of the past decade- Excerpt
“"The Average Equity Investor earned just 16.54% in 2024, compared to the S&P 500's 25.05% return. The 848 basis point lag represents the second-largest investor performance gap of the past decade." ”
- Source data from
- 2025-03-01
- Accessed
- 2026-04-19 · archived copy
- Calculation
- DALBAR's annual QAIB study measures the gap between market returns and the returns actually captured by investors, using mutual fund flow data. In 2024 the gap was 848 basis points — the second largest in a decade. The underperformance is driven primarily by behavioral factors: panic selling during downturns, late re-entry after recoveries begin, and poor market timing. This source substantiates the claim that the primary risk from a crash is behavioral (selling at the bottom), not the crash itself. The full QAIB report is paywalled; the statistics cited here come from DALBAR's publicly available press release.