What are the odds of losing your home to mortgage foreclosure?
Evidence quality 4.63/5
Eight-dimension review score against the quality rubric . Each dimension scored 1–5.
- D1 Source grounding
- 5/5
- D2 Source authority
- 5/5
- D3 Arithmetic
- 4/5
- D4 Uncertainty
- 4/5
- D5 Scope
- 5/5
- D6 Prose
- 5/5
- D7 Perception honesty
- 4/5
- D8 Caveat completeness
- 5/5
Lifetime probability · lifetime, activity-specific
1 in 14
7.0% lifetime chance
Most people overestimate this.
range 1 in 33 to 1 in 6.7
● your factors — click this risk ▾ to reveal
≈ As likely as

Perceived
The 2008 foreclosure crisis left a deep imprint on the American psyche. News footage of boarded-up subdivisions, underwater borrowers, and bank-owned signs became the dominant image of homeownership risk for an entire generation. Most adults who lived through it overestimate the current probability of foreclosure, anchoring on crisis-era imagery rather than the post-Dodd-Frank lending environment. Surveys of financial anxiety consistently rank "losing my home" near the top, often above risks that are statistically far more likely, such as job loss or medical bankruptcy.
Rough estimate: ~10-20% lifetime guess for anxious homeowners
Source: editorial intuition, not polled
Actual
~367,460 foreclosure filings in 2025 (0.26% of US housing units)
US housing units
Show derivation
ATTOM Data reported 367,460 properties with foreclosure filings in 2025, representing 0.26% of approximately 142 million US housing units. However, completed foreclosures (bank repossessions / REO) numbered only 46,439, or about 0.09% of mortgaged properties. The annual filing rate of 0.26% is a post-pandemic normalization figure, well below the pre-pandemic 2019 rate (~0.36%) and far below the 2010 peak (~2.23%). A BLS longitudinal cohort study (NLSY79, tracking baby boomers born 1957-1964 from 1988 to 2008) found that about 2% received a foreclosure notice and roughly 1.4% lost a home to foreclosure over a 20-year span — but that cohort happened to include the worst housing crisis in modern history. For a lifetime estimate spanning 30-35 years of potential mortgage exposure (age 25-60, with most homeowners holding 1-3 mortgages across the period), compounding the long-run average annual filing rate of roughly 0.2-0.3% across normal years but including one severe cycle gives approximately 5-10%. The central estimate of 7% reflects the reality that most homeowners will live through at least one serious recession but that post-2008 regulatory reforms (Qualified Mortgage rules, Dodd-Frank, tighter underwriting) have structurally reduced the tail risk relative to the pre-crisis era. The St. Louis Fed estimated that nearly 10 million homeowners lost homes between 2006 and 2014, out of roughly 50-55 million mortgaged homes at the time — a crisis-era cumulative rate of roughly 18-20%, which should not be treated as a baseline.
Caveats: The 7% central estimate is a constructed lifetime probability, not a directly ob…
The 7% central estimate is a constructed lifetime probability, not a directly observed population statistic. No single data source tracks individual homeowners from first mortgage to last. The BLS NLSY79 cohort study is the closest approximation but covers only 20 years (1988-2008) and a single birth cohort. The estimate assumes that most homeowners will hold mortgages for 25-35 years and experience at least one severe recession during that period. Post-2008 regulatory reforms (Qualified Mortgage rules, Dodd-Frank ability-to-repay requirements, higher capital requirements for banks) may have structurally reduced foreclosure risk for borrowers underwritten under the new regime, which would push the true lifetime probability below the 7% central estimate for younger homeowners. The filing-to-completion ratio is roughly 8:1, meaning most foreclosure filings are resolved before the home is actually lost; the headline "foreclosure filing" numbers substantially overstate actual home loss. Geographic variation is extreme: Sun Belt speculative markets (Nevada, Florida, Arizona) experienced 3-5x the national foreclosure rate during the crisis, while stable markets with strict lending norms (Texas, with its 80% LTV cap on cash-out refinances) fared much better.
Regional breakdown
The headline figure averages across very different populations. Here’s how the probability varies by geography or context:
| Region / context | Lifetime probability | Notes |
|---|---|---|
| 2006-2014 crisis era (cumulative) | 1 in 5.3 |
~10 million homes foreclosed out of ~52 million mortgaged; driven by subprime lending, negative equity, and lax underwriting |
| 2020-2025 post-pandemic (annual) | 1 in 385 |
Annual filing rate 0.23-0.26% of housing units; record homeowner equity and strict post-Dodd-Frank underwriting |
| Pre-crisis normal (2000-2006 annual) | 1 in 200 |
Annual filing rate roughly 0.4-0.6% of housing units before the subprime wave fully hit |
Risks at similar odds
Other risks with roughly the same likelihood — useful for calibration.


Commercial fishing career death
What are the odds of dying while working as a commercial fisher over a full career?


Recently viewed on this device
Stored locally — clear anytime.
Pick challenger
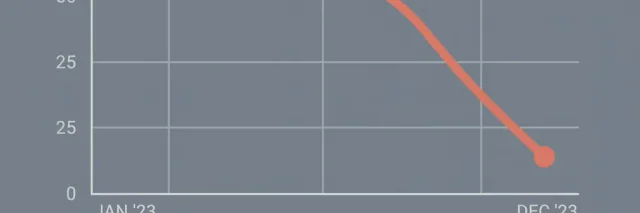
In 2025, lenders filed foreclosure actions on 367,460 US properties — default notices, scheduled auctions, and bank repossessions combined — representing 0.26% of all housing units. That is 87% below the 2010 peak of nearly 2.9 million filings, and 25% below the pre-pandemic 2019 baseline. Completed foreclosures (actual bank repossessions) numbered just 46,439, down 96% from the 2010 peak of 1,050,500.
These numbers describe a housing market that bears almost no resemblance to the one that generated the trauma most people carry. Between 2006 and 2014, nearly 10 million homeowners lost their homes to foreclosure — roughly one in five of all mortgaged households at the time. The Mortgage Bankers Association’s foreclosure inventory rate peaked at approximately 4.6% of all serviced loans in late 2010; by Q3 2025, it had fallen to 0.50%, near the lowest level since the MBA began tracking the metric.
The gap between perception and current reality is driven by two forces: the vividness of crisis-era imagery and the invisibility of the regulatory response. The Dodd-Frank Act’s Qualified Mortgage rules now require lenders to verify ability to repay, cap debt-to-income ratios, and prohibit the interest-only, no-documentation, and 100%-LTV products that were the proximate cause of most crisis-era defaults. Current homeowners hold a record $17.6 trillion in home equity, with the average mortgaged homeowner sitting on over $300,000 in equity. Negative equity — the single strongest predictor of foreclosure — is nearly absent from the current market.
The only US longitudinal study tracking individual homeowners through a full economic cycle is the BLS analysis of baby boomers born 1957-1964 (NLSY79 cohort), observed from 1988 to 2008. Over that 20-year period, about 7% experienced mortgage delinquency, roughly 2% received a foreclosure notice, and approximately 1.4% actually lost a home. That cohort’s observation window includes the onset of the worst housing crisis in modern history but not its full severity (peak completions ran 2009-2012). Extrapolating to a 30-35 year mortgage exposure window and factoring in the full crisis yields a lifetime estimate in the range of 5-10%, with a central value near 7% — or about 1 in 14 homeowners who carry a mortgage at some point during their adult life.
The strongest individual predictors are not recklessness but vulnerability: the BLS study found that divorce or widowhood and unemployment each more than doubled the probability of delinquency and tripled the probability of foreclosure. The 2008 crisis confirmed this at scale — it was not primarily a story of irresponsible borrowers but of an industry that made credit available on terms that could not survive a downturn, to borrowers whose income margins were too thin to absorb a payment shock. The regulatory apparatus built in response has not eliminated the risk, but it has meaningfully narrowed the channel through which the next crisis would have to flow.
Related tidbits
About 7% of US mortgages will end in foreclosure over a lifetime. A 2008-scale housing crash has ~12% lifetime odds. Foreclosure fear runs higher than the base rate, even in downturns.
7% lifetime probability of mortgage foreclosure. 10% for personal bankruptcy. You're more likely to lose everything than to lose just the house. Neither makes the financial planning brochure.
Claim ledger
Every number below is what each source reported, with the verbatim quote we relied on and how we arrived at our figure. Click any link to verify directly.
-
[1] ATTOM Data Solutions — U.S. Foreclosure Activity Increases in 2025
U.S. Foreclosure Activity Increases in 2025- Statistic
367,460 US properties with foreclosure filings in 2025 (0.26% of housing units), up 14% from 2024; 46,439 bank repossessions (REO), up 27% from 2024 but down 96% from the 2010 peak of 1,050,500- Excerpt
“"In 2025, foreclosure filings — default notices, scheduled auctions and bank repossessions — were reported on 367,460 U.S. properties, up 14 percent from 2024 and up 3 percent from 2023 but down 25 percent from 2019. Lenders repossessed 46,439 properties through foreclosures (REO) in 2025, up 27 percent from 2024 but down 68 percent from 143,955 in 2019, and down 96 percent from a peak of 1,050,500 in 2010." ”
- Source data from
- 2026-01-15
- Accessed
- 2026-04-19 · archived copy
- Calculation
- Primary source for the 2025 annual filing count and bank repossession count. 367,460 filings on ~142 million housing units = 0.26% annual filing rate. Completed foreclosures (REO) of 46,439 on ~52 million mortgaged homes = ~0.09% annual completion rate. The gap between filings and completions reflects the multi-stage foreclosure process: many filings are cured through loan modification, short sale, or reinstatement before reaching REO.
- Independence
- ATTOM aggregates county recorder data from over 3,000 counties nationwide. It is the primary private-sector foreclosure tracking source used by industry, media, and researchers. Independent of MBA survey-based data.
-
[2] Mortgage Bankers Association — Mortgage Delinquencies Increase in the Third Quarter of 2025
Mortgage Delinquencies Increase in the Third Quarter of 2025- Statistic
0.50% of mortgage loans in the foreclosure process in Q3 2025; foreclosure starts at 0.20% of serviced loans- Excerpt
“"The percentage of loans in the foreclosure process at the end of the third quarter was 0.50 percent, up 2 basis points from the second quarter of 2025 and 5 basis points higher than one year ago. The percentage of loans on which foreclosure actions were started in the third quarter rose by 3 basis points to 0.20 percent." ”
- Source data from
- 2025-11-14
- Accessed
- 2026-04-19 · archived copy
- Calculation
- MBA's National Delinquency Survey covers roughly 37 million loans, representing about 70% of all first-lien residential mortgages. The 0.50% foreclosure inventory rate and 0.20% foreclosure starts rate confirm the ATTOM data from a different methodology (servicer survey vs county records). The Q3 2025 foreclosure inventory rate of 0.50% is historically low — the peak was approximately 4.6% in Q4 2010.
- Independence
- MBA data is survey-based, collected directly from mortgage servicers, while ATTOM data comes from public county records. The two sources use fundamentally different methodologies and arrive at consistent conclusions.
-
[3] Federal Reserve Bank of St. Louis — The End Is in Sight for the U.S. Foreclosure Crisis
The End Is in Sight for the U.S. Foreclosure Crisis- Statistic
Nearly 10 million mortgage borrowers lost their homes between 2006 and early 2017; the crisis began in Q4 2007 and lasted roughly 10 years- Excerpt
“"This nearly 10-year nationwide foreclosure crisis was longer and deeper than anything seen since the Great Depression, with as many as 10 million mortgage borrowers potentially losing their homes." ”
- Source data from
- 2016-12-07
- Accessed
- 2026-04-19 · archived copy
- Calculation
- Provides the widely cited ~10 million figure for total homes lost during the crisis era. With roughly 50-55 million mortgaged homes at the time, this implies a crisis-era cumulative foreclosure rate of roughly 18-20%. This is the key data point for anchoring the upper bound of the lifetime uncertainty range, since most homeowners will experience at least one major recession during their mortgage-holding years.
- Independence
- St. Louis Fed research draws on ATTOM, CoreLogic, and MBA data but provides independent analytical framing and cumulative estimates not available from any single private source.
-
[4] U.S. Bureau of Labor Statistics — Patterns of homeownership, delinquency, and foreclosure among youngest baby boomers
Patterns of homeownership, delinquency, and foreclosure among youngest baby boomers- Statistic
~7% of the cohort experienced mortgage delinquency; ~2% received a foreclosure notice; ~1.4% lost a home to foreclosure over 20 years (1988-2008)- Excerpt
“"Almost 7 percent of the sample and 6 percent of 2008 homeowners were delinquent on mortgage payments over this period. In addition, about 2 percent of homeowners received a foreclosure notice. Divorce or widowhood and unemployment are associated with a greater probability of adverse housing outcomes — there is over twice the chance of delinquency and over three times the chance of receiving a foreclosure notice or losing one's home." ”
- Source data from
- 2013-02-01
- Accessed
- 2026-04-19 · archived copy
- Calculation
- The only US longitudinal cohort study tracking individual homeowners through a full economic cycle including the Great Recession. The 1.4% actual home-loss rate over 20 years for this cohort sets a floor for the lifetime estimate, since the observation period (1988-2008) includes the onset of the worst foreclosure crisis in modern history but not its full duration (peak completions were 2009-2012). Extrapolating to a 30-35 year mortgage exposure window and adding the 2009-2012 peak years brings the cohort estimate closer to 5-7%.
- Independence
- Uses the National Longitudinal Survey of Youth 1979 (NLSY79), a nationally representative panel survey independent of administrative foreclosure records.