Skip to content
Likelier
Other · reviewed 2026-05-16

What are the odds of filing a long-term disability claim for a musculoskeletal condition?

Evidence quality 4.5/5

Eight-dimension review score against the quality rubric . Each dimension scored 1–5.

D1 Source grounding
4/5
D2 Source authority
5/5
D3 Arithmetic
5/5
D4 Uncertainty
4/5
D5 Scope
5/5
D6 Prose
4/5
D7 Perception honesty
4/5
D8 Caveat completeness
5/5
Average 4.5/5
Direct evidence

Lifetime probability · lifetime, US adult

1 in 14

7.3% lifetime chance

Most people underestimate this.

range 1 in 20 to 1 in 9.1

lifetime, US adult each band = 10× rarer → zoomed to your factors See full scale →
certain 1 in 1K 1 in 1M 1 in 1B
1 in 6.8 1 in 23

● your factors — click this risk ▾ to reveal

≈ As likely as

A simplified spine or vertebral column shown as stacked geometric shapes, flat vector illustration in muted tones.

Perceived

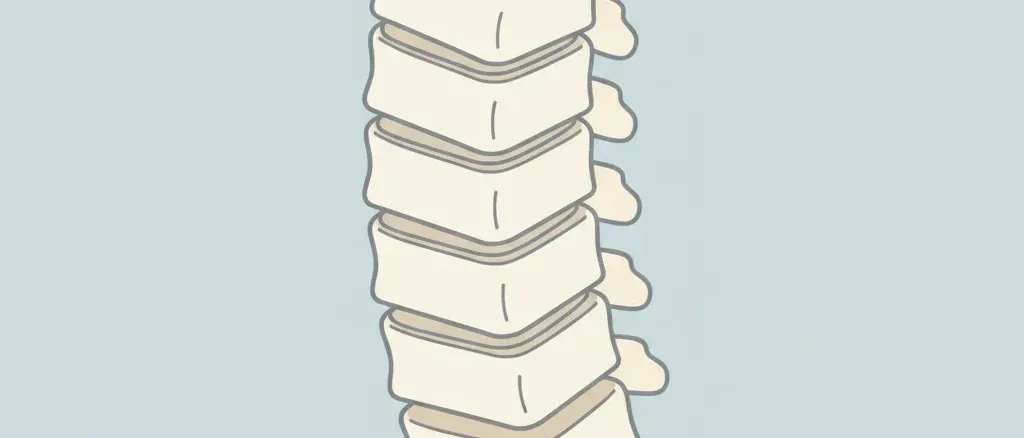
Most people assume that the leading cause of long-term disability is cancer, heart disease, or a serious accident. Musculoskeletal disorders — back pain, arthritis, degenerative disc disease, joint conditions — rarely come to mind as the top driver. The Council for Disability Awareness consistently finds musculoskeletal conditions responsible for roughly one-third of all long-term disability claims, making them the single largest category by a substantial margin. No survey directly measures what people guess the top cause to be, but the gap between public perception (accidents and cancer) and actual data (back and joint conditions) is documented across multiple insurer and advocacy sources.

Rough estimate: under 1 in 20 lifetime, most people guess

Source: editorial intuition, not polled

Actual

~30 in 100 long-term disability claims

US workers with long-term disability insurance claims

Show derivation

Two-step calculation. Step 1: SSA Fact Sheet states that just over 1 in 4 of today's 20-year-olds will become disabled (unable to work for 12+ months) before reaching normal retirement age (age 67). This implies a ~25% lifetime working disability probability. Step 2: CDA's long-term disability claims data finds musculoskeletal disorders account for approximately 29-30% of all LTD claims. Combining: 0.25 (lifetime disability probability) × 0.29 (musculoskeletal share of claims) ≈ 0.073. This chained estimate inherits uncertainty from both steps: the SSA figure is actuarial (includes all disabling conditions meeting SSDI criteria, not just employer LTD), and CDA's 29-30% figure is from insured employer LTD claims, a subset of all disabling events. The estimate is likely conservative for the broader disability definition and somewhat generous for the insured-LTD definition. Uncertainty range: 0.05-0.11.

Caveats: The 7.3% lifetime figure is a chained estimate: SSA's actuarial 25% lifetime wor…

The 7.3% lifetime figure is a chained estimate: SSA's actuarial 25% lifetime working disability probability × CDA's 29% musculoskeletal share of LTD claims. Both inputs carry uncertainty. The SSA figure is an actuarial projection for today's 20-year-olds entering the workforce; actual historical realized rates have varied. The CDA's 29% share is from insured employer LTD claims databases, which under-represent self-employed workers, informal workers, and workers without employer LTD coverage. The true population-level musculoskeletal disability rate is likely higher than 7.3% but less precisely documented because many musculoskeletal disabilities are managed without a formal LTD claim. "Long-term disability claim" as used here means a formal claim under an employer group LTD insurance policy, not including short-term disability, workers' compensation, or informal work absences. Back and neck conditions account for the majority of musculoskeletal LTD claims; arthritis and connective tissue disorders are the next largest sub-category.

Risks at similar odds

Other risks with roughly the same likelihood — useful for calibration.

Health

Mental health LTD claim

What are the odds of filing a long-term disability claim for a mental health condition?

Other

Logging career death

What are the odds of dying while working as a logger over a full career?

Other

Compulsive buying disorder

What are the odds of developing compulsive buying disorder?

Other

Crypto total loss

What are the odds of losing your entire cryptocurrency investment?

Other

Day-trading losses

What are the odds of significant financial loss from active retail trading?

Other

Dying without heir

What are the odds of dying with no one to inherit your estate?

Other

Elder fraud loss

How likely is an adult 60+ to lose money to a financial scam in retirement?

Other

Extremist govt catastrophe

What are the odds of a political extremist government catastrophically ruining your country?

Compare to:

Back pain, arthritis, and joint degeneration — not cancer, heart attacks, or accidents — are the leading cause of long-term disability insurance claims in the United States. The Council for Disability Income Awareness, which compiles data from large group LTD insurer claim databases, consistently finds that musculoskeletal disorders account for nearly one-third of all long-term disability claims, making them the single largest category. Cancer comes second at roughly 15%; injuries rank third at around 11%. The gap between public perception (which defaults to dramatic acute events) and the actual claims data (dominated by chronic, progressive joint and spine conditions) is one of the more consistent misfires in disability planning.

Translating the claims-share figure into a lifetime probability requires combining two estimates. The Social Security Administration states that just over 1 in 4 of today’s 20-year-olds will become disabled before reaching retirement age — a 25% lifetime working disability probability across all causes. Applying the musculoskeletal share (~29%) yields a lifetime musculoskeletal LTD probability of approximately 0.25 × 0.29 ≈ 7.3%, or roughly 1 in 14. This is an estimate, not a single-source figure; the two inputs are independently measured and the chained calculation inherits uncertainty from both. The true rate is likely higher because the SSA and CDA definitions exclude informal work absences and the large population of workers without employer LTD coverage.

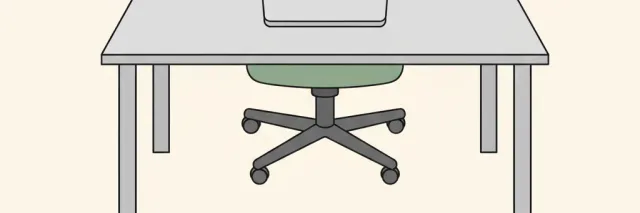
The risk accumulates across the working lifetime rather than arriving as a single event. Musculoskeletal conditions typically begin with episodic symptoms in the 30s and 40s, progressing to chronic limitation by the 50s and 60s. The age 55-64 working cohort has roughly double the musculoskeletal LTD claim rate of 20-34 year olds. Physically demanding occupations (construction, nursing, warehouse work) carry roughly double the risk of office-based work, but sedentary work with poor ergonomics also elevates the risk above baseline through repetitive strain. Consistent strength training is among the strongest modifiable protective factors.

Claim ledger

Every number below is what each source reported, with the verbatim quote we relied on and how we arrived at our figure. Click any link to verify directly.

  1. [1] The Council for Disability Income Awareness (CDIA) — The Top 5 Reasons Why People Go Out of Work and Stay Out of Work
    The Top 5 Reasons Why People Go Out of Work and Stay Out of Work

    See all 2 Likelier entries citing this source →

    Statistic
    Musculoskeletal disorders are responsible for nearly one-third (approximately 29-33%) of all long-term disability claims, making them the leading cause
    Excerpt
    “"Musculoskeletal disorders [are] responsible for a nearly third of all long-term disability claims." ”
    Source data from
    2018-04-30
    Accessed
    2026-05-14 · archived copy
    Calculation
    CDIA's analysis of LTD insurer claims data places musculoskeletal disorders as the single largest category at ~29-33% of claims (varies slightly by year and insurer dataset). Back and spine conditions are the largest sub-category within musculoskeletal. Cancer is the second most common cause at ~15% of claims, followed by injuries at ~11%. Mental health/nervous conditions account for ~9% and circulatory conditions ~9%. Step 1 calculation: SSA 25% lifetime disability × 0.29 musculoskeletal share = 0.073 lifetime unconditional probability.
    Independence
    CDIA compiles data from multiple large group LTD insurer claim databases. This is independent of SSA SSDI administrative data; employer LTD and SSDI have different eligibility thresholds and populations. Both sources converge on similar overall disability incidence.
  2. [2] Social Security Administration (SSA) — Social Security Basic Facts — Disability Statistics
    Social Security Basic Facts — Disability Statistics

    See all 2 Likelier entries citing this source →

    Statistic
    Just over 1 in 4 of today's 20-year-olds will become disabled before reaching normal retirement age (age 67)
    Excerpt
    “"Just over 1 in 4 of today's 20 year-olds can expect to be out of work for at least a year because of a disabling condition before they reach the normal retirement age." ”
    Source data from
    2024-01-01
    Accessed
    2026-05-14 · archived copy
    Calculation
    SSA fact sheet provides the ~25% lifetime working-age disability probability used in Step 1 of the chained calculation. This figure includes all disabling conditions meeting SSDI/SSI criteria. Applied to the musculoskeletal share (Step 2): 0.25 × 0.29 ≈ 0.073. The SSA figure is for workers entering the workforce today; historical cohort rates were lower. The 25% is widely cited as the standard lifetime working disability estimate.
    Independence
    SSA administrative data is independent of CDIA's LTD insurer claims data. SSA measures approved SSDI/SSI disability claims while CDIA measures employer group LTD insurance claims. The two populations partially overlap but are distinct: not all SSDI recipients have employer LTD coverage, and many LTD claimants do not meet SSDI criteria.

412 risks with measured probability
1 in 10 1 in 100 1 in 1K 1 in 10K 1 in 100K 1 in 1M 1 in 10M 1 in 100M 1 in 1B certain rarer → Cosmetic surgery abroad risk — 1 in 10 Infant sugar/salt and adult disease — 1 in 10 Endometriosis — 1 in 10 Hair transplant Turkey risk — 1 in 10 Knee replacement — 1 in 10 Chronic painkillers — 1 in 10 Elderly abandonment — 1 in 9.1 Complete tooth loss — 1 in 9.1 Alzheimer's — 1 in 8.3 Sleep deprivation — 1 in 8.3 Smokeless tobacco — 1 in 8.3 Cycling w/o helmet — 1 in 8.0 Bruxism tooth damage — 1 in 7.7 Vision loss — 1 in 6.7 Hernia from lifting — 1 in 6.7 Hip fracture risk — 1 in 6.7 Regular drinking — 1 in 6.7 First heart attack — 1 in 5.9 Infertility — 1 in 5.7 5+ years paid LTC — 1 in 5.6 CTE (football) — 1 in 5.0 Major depression — 1 in 4.9 Hiking injury — 1 in 4.8 Infection from sharing food with child — 1 in 4.2 Lyme disease — 1 in 4.0 Loneliness & health — 1 in 3.8 Job loss & depression — 1 in 3.7 Inheriting AUD risk — 1 in 3.5 Alcohol use disorder — 1 in 3.4 Menopause CV risk acceleration — 1 in 3.0 Silent diabetes — 1 in 3.0 Flying with cold — 1 in 2.9 Tick illness (forest) — 1 in 2.9 Silent high cholesterol — 1 in 2.9 Grandparent loss in childhood — 1 in 2.8 Pacifier floor drop — 1 in 2.8 Drug-resistant infection — 1 in 2.6 No marrow match — 1 in 2.4 Nursing home admission — 1 in 2.2 Skipping dental checkups — 1 in 2.1 False-positive mammogram — 1 in 2.0 Regular smoking — 1 in 2.0 Travelers' diarrhea — 1 in 2.0 Adventure sports — 1 in 1.8 Family caregiver probability — 1 in 1.8 LTC need after 65 — 1 in 1.8 Widowhood probability — 1 in 1.7 Unprotected sex — 1 in 1.5 Silent hypertension — 1 in 1.3 Chronic back pain — 1 in 1.3 Hand hygiene — 1 in 1.0 Cancer (any) — 1 in 7.1 E-scooter no helmet — 1 in 4.5 E-bike no helmet — 1 in 4.0 Mishandled luggage — 1 in 3.7 Deer collision — 1 in 2.7 At-fault injury crash — 1 in 2.5 Flight cancellation — 1 in 1.8 Trip disruption: war or disaster — 1 in 1.7 Home burglary (global) — 1 in 9.1 Hitchhiking assault — 1 in 8.8 Mail check fraud — 1 in 7.7 Child sexual abuse — 1 in 6.8 Stalking — 1 in 6.2 Student sexual assault — 1 in 5.7 Domestic violence — 1 in 3.7 Night walk assault — 1 in 3.6 Bicycle theft — 1 in 2.9 Sexual assault — 1 in 2.9 Home burglary — 1 in 2.6 Sexual harassment (lifetime) — 1 in 1.6 Water scarcity — 1 in 2.5 Carrington-class solar storm — 1 in 1.9 WAIS tipping point — 1 in 1.1 Indoor cat escape harm — 1 in 10 Off-leash dog bite — 1 in 8.9 Rabbit dies in 4 years — 1 in 3.3 Dog bite (non-fatal) — 1 in 1.8 Hamster dies before teenager — 1 in 1.0 Vitamin D gap — 1 in 2.9 Undercooked food — 1 in 1.6 Raw meat cross-contamination — 1 in 1.4 Food left out — 1 in 1.2 AI voice scam — 1 in 2.9 Online scam loss — 1 in 2.5 Teen cyberbullying — 1 in 2.0 Kids & explicit content — 1 in 1.9 Data breach — 1 in 1.1 Miscarriage — 1 in 6.7 Teen suicide attempt — 1 in 5.6 Postpartum depression — 1 in 4.8 Painkiller before infant vaccination — 1 in 3.8 Excessive pregnancy weight — 1 in 2.6 Unvaxxed child & measles — 1 in 2.0 Elder fraud loss — 1 in 10 Pension fund collapse — 1 in 10 Personal bankruptcy — 1 in 10 Housing crash — 1 in 8.3 Crypto total loss — 1 in 6.7 IRS audit — 1 in 6.7 Visa overstay deportation — 1 in 5.6 Long term disability working age — 1 in 4.0 Student loan default — 1 in 3.8 Whistleblower retaliation — 1 in 3.2 Career obsolescence — 1 in 2.9 Forced job exit before retirement — 1 in 2.9 Retirement shortfall — 1 in 2.6 Divorce — 1 in 2.4 Burst pipe damage — 1 in 2.2 Workplace bullying — 1 in 2.1 Deportation (undocumented) — 1 in 1.8 Funeral cost shock — 1 in 1.8 Identity theft — 1 in 1.7 Credit card fraud — 1 in 1.5 School bullying — 1 in 1.5 Insurance claim denial — 1 in 1.4 Frontline soldier casualty — 1 in 1.3 Economic recession — 1 in 1.0 Stock market crash — 1 in 1.0 Hail roof damage — 1 in 3.0 Dry toilet paper harm — 1 in 100 Secondhand smoke — 1 in 91 Gaming disorder (adults) — 1 in 83 High-heel ER visit — 1 in 79 Child throwing object — 1 in 67 Medication reaction — 1 in 58 Cat litter toxoplasmosis — 1 in 48 Mental health LTD claim — 1 in 45 Drug overdose — 1 in 42 Benzo dependence — 1 in 40 Tap water lead — 1 in 40 Medication misuse — 1 in 35 Traumatic brain injury — 1 in 33 Hospital infection — 1 in 31 Air pollution — 1 in 29 End-stage kidney disease — 1 in 29 Traveler's diarrhea (water) — 1 in 26 Skiing injury — 1 in 26 Bipolar disorder — 1 in 23 Dental tourism complication — 1 in 20 Pet parasites — 1 in 20 Undiagnosed ADHD — 1 in 20 Adult-onset food allergy — 1 in 19 Indoor cooking smoke — 1 in 18 Non-Alzheimer's dementia — 1 in 17 Working-age disabling stroke — 1 in 17 Cannabis use disorder — 1 in 16 Stroke — 1 in 15 Parent death/disability — 1 in 14 Severe hearing loss — 1 in 14 Type 2 diabetes — 1 in 13 Appendicitis — 1 in 13 Untreated depression — 1 in 13 Untreated back pain disability — 1 in 13 Heart disease — 1 in 12 Medical error death — 1 in 12 Compulsive sexual behavior — 1 in 12 Eating disorder — 1 in 11 Hip replacement — 1 in 11 Kidney stones — 1 in 11 Sedentary lifestyle — 1 in 11 Salon infection — 1 in 11 Ovarian cancer — 1 in 91 Colorectal cancer — 1 in 77 Breast cancer — 1 in 59 Liver cancer — 1 in 59 Lung cancer — 1 in 56 Prostate cancer — 1 in 50 Melanoma (UV) — 1 in 29 Low-fiber CRC risk — 1 in 23 Red meat & CRC — 1 in 21 Charred meat & cancer — 1 in 20 Maintenance crash — 1 in 83 Driving on sedating meds — 1 in 77 Texting + driving — 1 in 56 Driving after cannabis — 1 in 53 Eating while driving — 1 in 53 Unbelted crash death — 1 in 53 Speeding 20% over limit — 1 in 48 Motorcycle no helmet — 1 in 45 Spaceflight (astronaut) — 1 in 42 Video watching + driving — 1 in 32 Drowsy driving — 1 in 26 E-scooter injury — 1 in 26 Cruise ship norovirus — 1 in 24 Driving at 0.10% BAC — 1 in 16 Catalytic converter theft — 1 in 83 Pickpocketed while traveling — 1 in 38 Stabbed in an assault — 1 in 37 Vehicle theft — 1 in 34 Street robbery / mugging — 1 in 26 Wrongful conviction — 1 in 24 Drink spiking — 1 in 17 Protest under autocracy — 1 in 12 AMOC collapse — 1 in 20 Sting anaphylaxis — 1 in 50 Cat collar injury — 1 in 25 Fish bone injury — 1 in 68 Restaurant food poisoning — 1 in 58 Vegetarian deficiency — 1 in 25 Intimate deepfake — 1 in 25 Social media problematic use — 1 in 13 Infant fall — 1 in 100 Childbirth death (SSA) — 1 in 55 Co-sleeping death — 1 in 43 Toddler stair fall — 1 in 37 Play swing & slide injury — 1 in 33 Autism diagnosis — 1 in 31 C-section complications — 1 in 29 Toy injury requiring ER (child) — 1 in 21 Preeclampsia — 1 in 20 Severe birth tearing — 1 in 17 Gestational diabetes — 1 in 13 Child fall head injury — 1 in 12 Sports betting financial ruin — 1 in 100 Fighter pilot death — 1 in 48 Commercial fishing career death — 1 in 45 Logging career death — 1 in 34 Dying without heir — 1 in 33 Medical bankruptcy — 1 in 25 Compulsive buying disorder — 1 in 20 Rental listing scam loss — 1 in 20 Mortgage foreclosure — 1 in 14 Musculoskeletal LTD claim — 1 in 14 Day-trading losses — 1 in 13 Extremist govt catastrophe — 1 in 13 Hurricane home destruction — 1 in 17 LASIK complications — 1 in 1,000 Infant pool submersion — 1 in 800 MS — 1 in 769 Workplace fatality — 1 in 690 Typhoid fever — 1 in 654 Unsafe imported products — 1 in 565 Brain aneurysm — 1 in 400 COVID-19 — 1 in 400 Fireworks injury — 1 in 385 Sickle cell disease — 1 in 365 Counterfeit medicine — 1 in 361 Spinal cord injury — 1 in 313 Childhood cancer diagnosis — 1 in 285 Next pandemic death — 1 in 208 Dengue (travel) — 1 in 200 Skipping daily showers — 1 in 200 Not scrubbing feet — 1 in 200 Marrow donation risk — 1 in 167 Schizophrenia — 1 in 143 Accidental fall — 1 in 135 Parkinson's — 1 in 125 Sudden death during exercise — 1 in 123 Suicide (US) — 1 in 121 Opioid addiction — 1 in 114 Tuberculosis (global) — 1 in 108 Radon cancer — 1 in 435 Testicular cancer — 1 in 250 Cervical cancer — 1 in 167 Pancreatic cancer — 1 in 125 Pedestrian death — 1 in 806 Motorcycle crash — 1 in 694 Boating drowning — 1 in 685 Driver kills pedestrian — 1 in 552 Phone-distracted walking injury — 1 in 400 EV battery fire — 1 in 333 Cyclist killed by car — 1 in 196 Hand-held phone call + driving — 1 in 143 Petrol car fire — 1 in 125 Self-driving car fatality — 1 in 115 Car crash — 1 in 105 Firefighter duty death — 1 in 455 Police duty death — 1 in 313 Homicide — 1 in 287 Pig-butchering scam — 1 in 106 Extreme heat — 1 in 333 Climate change death — 1 in 204 Swallowed bee/wasp — 1 in 500 Bat bite & rabies — 1 in 238 Mosquito-borne disease — 1 in 190 Food poisoning (global) — 1 in 317 Solar panel fire — 1 in 667 Untreated childhood scoliosis — 1 in 1,000 Child window fall — 1 in 855 Walker stair fall — 1 in 625 Baby walker injury — 1 in 455 Maternal mortality — 1 in 272 Untreated childhood flat feet — 1 in 250 Maternal age & birth defects — 1 in 200 Child death (<18) — 1 in 143 Caving career death — 1 in 167 EMS duty death — 1 in 794 Civilian war casualty — 1 in 499 Soldier in combat — 1 in 270 Mining career death — 1 in 214 Gambling financial ruin — 1 in 159 Wildfire home destruction — 1 in 120 Lightning home fire — 1 in 105 Malaria (travel) — 1 in 10,000 Infection from shared drink — 1 in 10,000 Chagas disease — 1 in 8,475 Wild berry fox tapeworm — 1 in 8,475 Schistosomiasis death — 1 in 6,667 Sudden death (young adult) — 1 in 3,922 Unsafe wiring — 1 in 3,390 Sepsis from wound — 1 in 2,857 Anesthesia awareness — 1 in 2,500 Heat stroke (outdoor) — 1 in 1,905 House fire — 1 in 1,818 Rabies from dogs — 1 in 1,449 Drowning — 1 in 1,379 Shallow-water diving SCI — 1 in 1,111 Choking — 1 in 1,099 EVALI vaping hospitalization — 1 in 1,064 Betel nut cancer — 1 in 1,290 Blood clot (flight) — 1 in 4,651 Killing a cyclist — 1 in 3,937 Teen road-crash death — 1 in 3,030 Child rear bike seat — 1 in 2,500 Child without restraint — 1 in 2,000 Fatal police encounter — 1 in 4,739 Honor killing — 1 in 2,381 Intimate-partner homicide — 1 in 1,767 Hurricane — 1 in 8,929 Drought famine death — 1 in 6,536 Blizzard death — 1 in 4,367 Earthquake — 1 in 3,802 Dog chocolate death — 1 in 2,000 Food poisoning (US) — 1 in 1,862 Fish mercury — 1 in 1,695 Phone/laptop battery fire — 1 in 1,136 SIDS — 1 in 7,143 Laundry pod ingestion — 1 in 6,494 Untreated infant hip dysplasia — 1 in 5,000 Pool drowning — 1 in 2,299 War (civilian) — 1 in 2,000 Fatal bee/wasp sting — 1 in 76,923 Anesthesia death — 1 in 50,000 Dog hot car death — 1 in 41,667 Anaphylaxis — 1 in 27,548 Chiropractic neck manipulation — 1 in 16,667 CO poisoning — 1 in 14,006 Hepatitis A (travel) — 1 in 12,500 Skipping allergy immunotherapy — 1 in 11,111 Acrylamide & cancer — 1 in 16,667 Bus crash — 1 in 100,000 Plane crash — 1 in 58,824 Child pedestrian (residential) — 1 in 45,455 Railroad crossing death — 1 in 20,704 Child bike trailer — 1 in 14,286 Acid attack — 1 in 89,286 Terrorism — 1 in 77,519 Child stranger abduction — 1 in 38,760 Stranger kidnapping — 1 in 35,211 Dowry death — 1 in 13,158 Accidental gun death — 1 in 11,299 Wildfire — 1 in 100,000 Tornado — 1 in 80,645 Tsunami — 1 in 52,632 Ocean drowning — 1 in 29,155 Flood — 1 in 20,202 Landslide death — 1 in 18,416 Supervolcano eruption — 1 in 12,376 Crocodile attack — 1 in 84,746 Bee sting — 1 in 78,927 Fatal scorpion sting — 1 in 26,110 Plastic container leaching — 1 in 16,949 Infant in car seat — 1 in 64,935 Bouncer chair fall — 1 in 60,606 Toddler choking — 1 in 50,000 Unsupervised infant choking — 1 in 50,000 Magnet ingestion — 1 in 12,048 Snorkeling death — 1 in 21,739 Pet in transport — 1 in 20,000 Landmine or UXO injury — 1 in 14,728 Vaccine reaction — 1 in 763,359 Aluminum & Alzheimer's — 1 in 169,492 Residential gas leak — 1 in 140,845 Child hot car death — 1 in 102,041 Glyphosate & cancer — 1 in 1,000,000 Teflon cookware cancer — 1 in 169,492 Roller coaster injury — 1 in 312,500 Cruise ship accident — 1 in 188,679 Ferry sinking — 1 in 133,333 Turbulence injury — 1 in 114,943 School shooting — 1 in 192,308 Mass shooting — 1 in 113,636 Nuclear accident — 1 in 833,333 Avalanche — 1 in 210,526 Lightning — 1 in 209,205 Snake bite — 1 in 884,956 Spider bite — 1 in 833,333 Hippo attack — 1 in 564,972 Dog bite — 1 in 142,045 Pesticide residue — 1 in 1,000,000 Dirty can illness — 1 in 200,000 PLA bioplastic harm — 1 in 169,492 Charger left plugged in — 1 in 200,000 Infant swing death — 1 in 714,286 Child blind cord strangulation — 1 in 416,667 Child plastic bag suffocation — 1 in 263,158 Button battery — 1 in 250,000 Inclined sleeper death — 1 in 238,095 Elevator/escalator death — 1 in 188,324 Japanese encephalitis (travel) — 1 in 2,000,000 Kid + front airbag — 1 in 10,000,000 Asteroid impact — 1 in 1,351,351 Banana spider eggs — 1 in 10,000,000 Shark attack — 1 in 5,681,818 Bear attack — 1 in 3,787,879 Wild berry poisoning — 1 in 2,222,222 Space debris hits property — 1 in 10,000,000 Piranha attack — 1 in 135,135,135 Phone at gas pump — 1 in 1,000,000,000 Phone on plane — 1 in 1,000,000,000 Alien contact — 1 in 169,491,525
Lottery jackpot 1 in 95,238