What are the odds of the AMOC experiencing an abrupt collapse before the end of your lifetime?
Evidence quality 4.75/5
Eight-dimension review score against the quality rubric . Each dimension scored 1–5.
- D1 Source grounding
- 5/5
- D2 Source authority
- 5/5
- D3 Arithmetic
- 3/5
- D4 Uncertainty
- 5/5
- D5 Scope
- 5/5
- D6 Prose
- 5/5
- D7 Perception honesty
- 5/5
- D8 Caveat completeness
- 5/5
Lifetime probability · lifetime, global adult
1 in 20
5.0% lifetime chance
Most people underestimate this.
range 1 in 100 to 1 in 2.5
≈ As likely as
Perceived
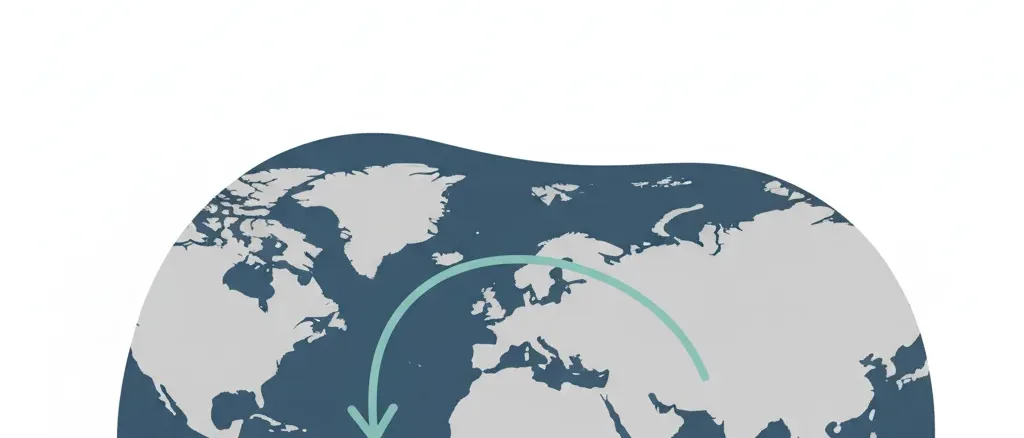
The Atlantic Meridional Overturning Circulation is not a household phrase, and its potential collapse has only recently acquired mainstream visibility. Popular coverage tends to oscillate between dismissal ("scientists say the ocean conveyor belt is slowing") and catastrophism (headlines invoking the film "The Day After Tomorrow," whose depiction of instantaneous freezing was scientific fiction). The concept of ocean circulation tipping points entered wider public awareness after the 2021 IPCC report and again after a contested 2023 paper predicted collapse potentially mid-century. Chapman University's Survey of American Fears does not track AMOC awareness specifically; broader climate anxiety data suggests roughly 48% of Americans report being afraid or very afraid of global warming and climate change (Chapman 2024), but specific tipping points like AMOC are not disaggregated. The risk sits somewhere between actively feared and largely unrecognized.
Rough estimate: ~47.7% of US adults report being 'afraid' or 'very afraid' of global warming and climate change broadly (Chapman University Survey, Wave 10, 2024) — no AMOC-specific survey data exists
Actual
~5% probability of abrupt AMOC collapse before 2100 (IPCC AR6 'very unlikely' = 0–10%)
Global population — AMOC collapse is a planetary-scale event with no population-specific probability
Show derivation
IPCC AR6 WG1 (2021) assessed that AMOC will "very likely" weaken over the 21st century but that abrupt collapse before 2100 is "very unlikely" with "medium confidence." IPCC calibrated language: "very unlikely" = 0–10% probability. Using 5% as the midpoint of that range gives the headline figure. This is a civilizational-event probability, not a personal death probability: AMOC collapse would not instantly kill anyone, but would trigger a cascade of consequences (European winter temperature drops of 5-15°C, sea level rise acceleration on the US East Coast, tropical rainfall belt disruption) whose indirect mortality over decades would be substantial. Observation-based studies produce significantly higher estimates: Ditlevsen and Ditlevsen (2023, Nature Communications) derived a central collapse date of 2057 with 95% CI of 2025-2095 from statistical early-warning signals in sea-surface temperature proxies, implying a >50% probability within a 50-year adult lifetime. Smolders et al. (2024) estimated the probability of AMOC collapse before 2050 at 59 ± 17% using physics-based salinity indicators. Both approaches are contested on methodological grounds by multiple senior oceanographers, and a 2025 34-model ensemble study (Baker et al., Nature) found AMOC resilient to collapse under all tested forcing scenarios. The wide uncertainty band (1-40%) reflects this genuine scientific disagreement, not merely statistical uncertainty around a known distribution.
Caveats: The 5% headline follows IPCC AR6's calibrated "very unlikely" language (0-10% pr…
The 5% headline follows IPCC AR6's calibrated "very unlikely" language (0-10% probability, medium confidence) and represents the scientific consensus anchor rather than the full range of published estimates. Observation-based studies (Ditlevsen 2023; Smolders et al. 2024) yield substantially higher estimates — 50-60% probability of collapse by mid-century — but these methods are contested on proxy representativeness, time-series length, and model assumptions. The Baker et al. 2025 34-model ensemble study argues for AMOC resilience under all tested scenarios, supporting the IPCC's "very unlikely" assessment. The scientific debate is genuinely unresolved; the uncertainty band (1-40%) reflects this rather than merely statistical uncertainty around a known parameter. AMOC "collapse" in this entry means an abrupt, self-sustaining reduction to a dramatically weakened state — not the gradual weakening (currently assessed as "very likely") that is already underway. Consequences of collapse would unfold over years to decades, not overnight: European winter temperatures could drop 5-15°C over timescales of 10-30 years, sea level on the US East Coast would rise by an additional 10-50 cm above baseline projections, and tropical rainfall patterns would shift substantially. The lifetime figure is a probability that the event is triggered, not that its consequences are fully realised, in the focal adult's lifetime.
Risks at similar odds
Other risks with roughly the same likelihood — useful for calibration.
WAIS tipping point
What are the odds of the West Antarctic Ice Sheet's tipping point being crossed in your lifetime?

Hurricane home destruction
What are the odds that a hurricane will destroy a coastal home during a 30-year ownership period?


Extremist govt catastrophe
What are the odds of a political extremist government catastrophically ruining your country?


Drought famine death
What are the odds of dying from drought-induced famine or water scarcity?
Recently viewed on this device
Stored locally — clear anytime.
Pick challenger
The Atlantic Meridional Overturning Circulation is the vast network of ocean currents that transports warm surface water northward through the Atlantic and returns cold, deep water southward — the system responsible for northwestern Europe’s mild climate relative to its latitude. IPCC AR6 (2021) assessed that AMOC will “very likely” continue to weaken over the 21st century, but that an abrupt collapse is “very unlikely” (0-10%) with “medium confidence.” Using the midpoint of that calibrated range gives a ~5% lifetime probability of abrupt collapse before 2100. Caesar and colleagues (2018, Nature) documented that AMOC has already weakened by approximately 15% since the mid-twentieth century, using an independent sea-surface temperature fingerprinting approach that is consistent with RAPID array direct measurements begun in 2004.
The scientific debate is unusually polarised. Observation-based early-warning studies (Boers 2021, Nature Climate Change; Ditlevsen 2023, Nature Communications; van Westen 2024, Science Advances) identify statistical and physical signals consistent with AMOC approaching a tipping threshold, with Ditlevsen’s contested analysis predicting collapse most likely between 2025 and 2095. These findings imply a much higher probability than the IPCC consensus — in some estimates, 50-60% before mid-century. The counterargument came in February 2025 from Baker et al. (Nature), whose 34-model ensemble found AMOC resilient to collapse under all tested forcing scenarios, with Southern Ocean wind-driven upwelling sustaining the circulation even under extreme greenhouse gas concentrations. The IPCC’s “very unlikely” assessment rests primarily on this model-ensemble evidence. Both camps are publishing in leading peer-reviewed journals; the discrepancy is not a matter of one side being wrong in an obvious way.
Should AMOC collapse occur, the consequences within the following few decades would be substantial. Van Westen et al.’s consequence modelling projects European winter temperature drops of 5-15°C across northwestern Europe, with London’s average winter temperature falling from roughly 7°C to near 2°C and Oslo’s to well below -10°C. Sea level on the US East Coast would rise by an additional 10-50 cm above baseline sea level rise projections, as the ocean surface that AMOC currently depresses would rebound northward. The Amazon rainforest would face additional drying as tropical rainfall patterns shift. These are not immediate effects but decadal-to-century timescale consequences of a threshold crossing that, if it occurs, would likely be irreversible on any timescale relevant to human planning.
Claim ledger
Every number below is what each source reported, with the verbatim quote we relied on and how we arrived at our figure. Click any link to verify directly.
-
[1] Intergovernmental Panel on Climate Change (IPCC), Working Group I, Sixth Assessment Report — Climate Change 2021: The Physical Science Basis — Chapter 9: Ocean, Cryosphere and Sea Level Change
Climate Change 2021: The Physical Science Basis — Chapter 9: Ocean, Cryosphere and Sea Level ChangeSee all 2 Likelier entries citing this source →
- Statistic
AMOC will 'very likely' weaken over the 21st century; abrupt collapse before 2100 is 'very unlikely' (0-10%) with medium confidence; projected AMOC weakening of 24-39% under low-to-high emissions scenarios- Excerpt
“"There is medium confidence that the decline will not involve an abrupt collapse before 2100. The AMOC will very likely weaken over the 21st century (high confidence), although a collapse is very unlikely (medium confidence)." ”
- Source data from
- 2021-08-09
- Accessed
- 2026-05-09 · archived copy
- Calculation
- IPCC calibrated language: "very unlikely" = 0-10% probability. Using 5% as the midpoint of this range for the headline. The "medium confidence" modifier (rather than high confidence) indicates limited model agreement on the abrupt-collapse question specifically. The IPCC does not give a numerical probability; 5% is the author's interpretation of the calibrated language midpoint. The 59-year adult lifetime window (age 18 to 77) maps roughly onto the "before 2100" horizon.
-
[2] Nature — Caesar, Rahmstorf et al., 2018 — Observed fingerprint of a weakening Atlantic Ocean overturning circulation
Observed fingerprint of a weakening Atlantic Ocean overturning circulation- Statistic
AMOC has weakened by approximately 3 ± 1 sverdrups (around 15%) since the mid-20th century, revealed by characteristic sea-surface temperature fingerprint- Excerpt
“"The AMOC has weakened by about 3 ± 1 sverdrups (around 15 per cent) since the mid-twentieth century, revealed by a characteristic spatial and seasonal sea-surface temperature 'fingerprint' — consisting of a pattern of cooling in the subpolar Atlantic Ocean and warming in the Gulf Stream region." ”
- Source data from
- 2018-04-11
- Accessed
- 2026-05-09 · archived copy
- Calculation
- Caesar et al. 2018 is the observational foundation for the AMOC weakening narrative. The 15% weakening since the mid-20th century is separate from the collapse-probability question — weakening and collapse are different states, and the IPCC projects continued weakening with high confidence even while assessing collapse as very unlikely. This source establishes that AMOC is not stable at its current state, providing the background against which collapse probability must be assessed.
- Independence
- Caesar et al. use an independent SST-based fingerprinting approach developed separately from the RAPID array direct measurements (which began in 2004) and from the statistical early-warning methods of Boers 2021 and Ditlevsen 2023. The three methodologies corroborate each other on the weakening trend.
-
[3] Nature Communications — Ditlevsen and Ditlevsen, 2023 — Warning of a forthcoming collapse of the Atlantic meridional overturning circulation
Warning of a forthcoming collapse of the Atlantic meridional overturning circulation- Statistic
Statistical early-warning signals in SST proxies predict central AMOC collapse in 2057 (95% CI: 2025-2095); method is contested by multiple senior oceanographers- Excerpt
“"Data-driven estimators for the time of tipping predict a potential AMOC collapse mid-century under the current emission scenario, with a 95% confidence interval of 2025–2095." ”
- Source data from
- 2023-07-25
- Accessed
- 2026-05-09 · archived copy
- Calculation
- Ditlevsen 2023 derives its estimate from statistical early-warning signals (variance and autocorrelation growth) in North Atlantic SST proxies interpreted as fingerprints of approaching instability. The method is contested: Prof. Penny Holliday (National Oceanography Centre) stated "sea surface temperature of the North Atlantic subpolar gyre is not a clear indicator of the state of the AMOC"; Prof. Niklas Boers (TU Munich) argued "uncertainties in the heavily oversimplified model assumptions... are too high"; Dr. Levke Caesar (Univ. Bremen) stated "the resulting time series are too short." This source represents the upper bound of the scientific plausibility range and is not the headline figure, but it anchors the upper end of the uncertainty band.
- Independence
- Ditlevsen 2023 is methodologically distinct from the IPCC's model-ensemble approach and from Caesar 2018's SST fingerprinting. It is included to represent the range of scientific opinion rather than as an independent confirmation of any single estimate.
-
[4] Science Advances — van Westen, Kliphuis and Dijkstra, 2024 — Physics-based early warning signal shows that AMOC is on tipping course
Physics-based early warning signal shows that AMOC is on tipping course- Statistic
Freshwater transport indicator (F_ovS) shows significant negative trend over past 40 years, consistent with AMOC approaching tipping point; European temperature drops of 5-15°C projected in collapse scenario- Excerpt
“"Reanalysis products indicate that the present-day AMOC is on route to tipping... Temperature trends exceed 1°C per decade across northwestern Europe during collapse." ”
- Source data from
- 2024-02-09
- Accessed
- 2026-05-09 · archived copy
- Calculation
- Van Westen 2024 uses a physics-based indicator (minimum of AMOC-induced freshwater transport, F_ovS) rather than statistical proxies. It finds a statistically significant negative trend of -1.20 mSv/year over the past 40 years, consistent with approach to tipping, but explicitly states inability to determine when tipping would occur. The consequence model run shows London's average winter temperature falling to ~1.9°C (from ~7°C today) and Oslo's to -16.5°C. These are consequences of full collapse, not of the current trajectory in isolation.
- Independence
- Van Westen et al. use a different indicator (F_ovS from ocean reanalysis products) than Ditlevsen 2023 (SST statistical signals) or Caesar 2018 (SST fingerprinting), providing genuinely independent physics-based evidence for AMOC approaching instability.
-
[5] Nature — Baker et al. (Met Office and University of Exeter), 2025 — Continued Atlantic overturning circulation even under climate extremes
Continued Atlantic overturning circulation even under climate extremes- Statistic
34-model ensemble finds AMOC resilient to collapse under all tested greenhouse gas and freshwater forcing scenarios; Southern Ocean wind-driven upwelling sustains circulation- Excerpt
“"The AMOC is resilient to extreme greenhouse gas and North Atlantic freshwater forcings across 34 climate models." ”
- Source data from
- 2025-02-19
- Accessed
- 2026-05-09 · archived copy
- Calculation
- Baker et al. 2025 is the primary model-based counterargument. The 34-model ensemble finds that Southern Ocean upwelling — not captured in the observation-based early-warning studies — sustains AMOC circulation even under extreme forcing. This mechanism explains why most CMIP climate models do not show AMOC collapse this century, which IPCC AR6 uses as the primary basis for its "very unlikely" assessment. Baker 2025 is cited here as a materially important dissenting view that anchors the lower end of the uncertainty range. The discrepancy between the observation-based (Ditlevsen, Boers, van Westen) and model-based (Baker, IPCC) views is the fundamental unresolved debate in AMOC science.
- Independence
- Baker et al. is methodologically opposed to the observation-based early-warning literature — it uses fully coupled climate models rather than statistical signals — and its conclusion directly contradicts the observation-based studies. Both methodologies are active areas of peer-reviewed research; neither has been refuted.