Skip to content
Likelier
Health · reviewed 2026-05-10

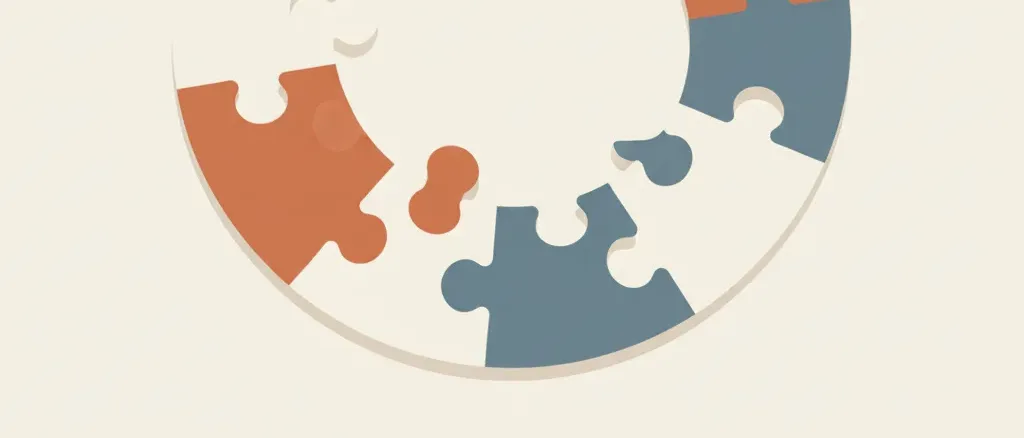
What are the odds of not finding a bone marrow donor match?

Evidence quality 4.5/5

Eight-dimension review score against the quality rubric . Each dimension scored 1–5.

D1 Source grounding
5/5
D2 Source authority
5/5
D3 Arithmetic
4/5
D4 Uncertainty
4/5
D5 Scope
5/5
D6 Prose
5/5
D7 Perception honesty
4/5
D8 Caveat completeness
4/5
Average 4.5/5
Direct evidence

Lifetime probability · lifetime, subgroup

1 in 2.4

42% lifetime chance

Most people underestimate this.

range 1 in 4.0 to 1 in 1.4

lifetime, subgroup each band = 10× rarer → zoomed to your factors See full scale →
certain 1 in 1K 1 in 1M 1 in 1B
1 in 1.4 1 in 4.0

● your factors — click this risk ▾ to reveal

≈ As likely as

Abstract puzzle pieces in muted tones with one piece missing, flat vector illustration representing the challenge of finding a donor match.

Perceived

Most people who have not personally needed a bone marrow transplant assume the registry system works like a blood bank — show up, get matched, receive a transplant. The reality of HLA matching, where doctors need to align 8 to 10 of 12 genetic markers, is poorly understood. The perception gap runs in both directions depending on the audience: white patients tend to underestimate the difficulty because the registry was built around donors who look like them, while patients from minority communities often learn the hard way that their match probability is dramatically lower. Public awareness campaigns have improved since the early 2000s, but the structural inequity remains largely invisible to the general public.

Rough estimate: Most people assume a match can be found for anyone who needs one

Source: editorial intuition, not polled

Actual

~75% match likelihood for White patients; ~29% for Black patients (8/8 HLA match)

US patients searching NMDP registry

Show derivation

The NEJM 2014 study by Gragert et al. estimated match likelihoods by race/ethnicity in the US registry. The population-weighted average failure rate for an 8/8 HLA match is roughly 42%, heavily skewed by the low match rates for Black (71% failure), Hispanic (48% failure), and multiracial (71% failure) patients vs White (7% failure). This is a per-search probability, not a cumulative lifetime figure, but it represents the reality facing any patient who needs an unrelated donor transplant.

Caveats: The 42% average failure rate applies to optimal 8/8 HLA-matched unrelated donors…

The 42% average failure rate applies to optimal 8/8 HLA-matched unrelated donors. Recent advances in haploidentical (half-matched family donor) transplantation and improved mismatched unrelated donor protocols have expanded options significantly. NMDP data from 2024 shows that when 5/8 to 7/8 mismatched donors are considered, virtually all patients have at least one suitable donor available. The clinical question has shifted from "can we find any donor" to "can we find the best donor for optimal outcomes."

Risks at similar odds

Other risks with roughly the same likelihood — useful for calibration.

Health

Silent hypertension

What are the odds of having undiagnosed high blood pressure without regular monitoring?

Health

Vision loss

What are the odds of losing significant vision in a lifetime?

Health

Adventure sports

What are the odds of a serious injury from regular participation in surfing, mountain biking, or rock climbing?

Health

Alcohol use disorder

What are the odds of developing alcohol use disorder over a lifetime?

Health

Drug-resistant infection

What is the risk of developing a serious antibiotic-resistant infection?

Health

Family caregiver probability

How likely am I to become an unpaid family caregiver — and what is the mental-health toll?

Health

Inheriting AUD risk

If a parent had alcohol use disorder, what are the odds you'll develop alcohol use disorder yourself?

Health

Chronic back pain

What are the odds of developing chronic back pain?

Compare to:

Finding a bone marrow donor is not like finding a blood donor. HLA matching requires alignment on 8 to 10 of 12 genetic markers, and the combinatorial complexity means that even a registry of 22 million donors cannot guarantee a match for every patient. The landmark Gragert et al. study in the New England Journal of Medicine quantified what transplant physicians had long observed: White patients have a 75% chance of finding an 8/8 HLA-matched unrelated donor, while Black patients have only a 29% chance. Hispanic and Asian American patients fall between at 46% and 42%, respectively. The population-weighted average failure rate is roughly 42%.

The disparity has two roots, and only one is addressable by recruitment. The first is registry composition: as of the most recent data, roughly 74% of NMDP donors are White, while Black donors make up about 7%. The second is biological — populations of African descent carry substantially greater HLA diversity than populations of European descent, a legacy of deeper genetic history on the African continent. Greater diversity means that any given patient’s HLA type is less likely to appear in someone else, even within the same ethnic group. Proportional representation in the registry would help but would not eliminate the gap entirely; closing it further requires a much larger registry overall.

The clinical landscape has shifted since the Gragert data were published. Haploidentical transplantation — using a half-matched family member, typically a parent or sibling — has matured from experimental to standard of care, particularly with post-transplant cyclophosphamide protocols. NMDP’s own 2024 data confirms that when partially mismatched unrelated donors (5/8 to 7/8) are included, virtually all patients now have at least one suitable donor. The question has moved from binary availability to outcome optimization: a perfect 8/8 match still yields better survival statistics than a haploidentical graft, so the registry gap remains clinically meaningful even as it becomes less often fatal.

Claim ledger

Every number below is what each source reported, with the verbatim quote we relied on and how we arrived at our figure. Click any link to verify directly.

  1. [1] New England Journal of Medicine — HLA Match Likelihoods for Hematopoietic Stem-Cell Grafts in the U.S. Registry
    HLA Match Likelihoods for Hematopoietic Stem-Cell Grafts in the U.S. Registry
    Statistic
    8/8 HLA match probability: 75% White, 46% Hispanic, 42% Asian, 29% Black; registry composition is 74% White donors
    Excerpt
    “"The probability of finding a match within the NMDP registry is estimated to be 0.93 for Whites, 0.82 for Hispanics, 0.77 for Asian Americans and 0.58 for Blacks when considering 7/8 matches. For 8/8 HLA matches, the probability is 0.75 for Whites, 0.46 for Hispanics, 0.42 for Asian Americans, and 0.29 for Blacks." ”
    Source data from
    2014-07-24
    Accessed
    2026-04-18 · archived copy
    Calculation
    Gragert et al. analyzed HLA haplotype frequencies in the NMDP registry against patient need. The 8/8 match is the clinical gold standard for unrelated donor transplant. The racial disparity arises from two compounding factors: (1) greater HLA diversity in populations of African and mixed ancestry, requiring a larger pool to find any given match, and (2) underrepresentation of minority donors in the registry (74% White at time of study). The normalized figure uses a population-weighted average across US racial demographics.
  2. [2] NMDP (formerly Be The Match) — Why Ethnicity Matters for Bone Marrow Transplants
    Why Ethnicity Matters for Bone Marrow Transplants
    Statistic
    71% of Black patients, 71% of multiracial patients, 52% of Latino/Hispanic patients, and 53% of Asian American patients lack a perfectly matched donor in the worldwide registry
    Excerpt
    “"71% of Blacks, 71% of multi-racial individuals, 52% of Latinos and Hispanics, and 53% of Asian Americans do not have a perfectly matched donor in the worldwide registry. A patient's ethnic background is important in predicting the likelihood of finding a match because HLA is inherited." ”
    Source data from
    2025-01-01
    Accessed
    2026-04-18 · archived copy
    Calculation
    NMDP's current diversity page updates the Gragert et al. data with more recent registry composition. The figures are broadly consistent with the 2014 NEJM study, suggesting that despite recruitment efforts, the structural gap has not closed substantially. The registry now includes over 22 million donors worldwide but remains majority White.
  3. [3] PMC / Bone Marrow Transplantation — Racial disparities in hematopoietic cell transplantation in the United States
    Racial disparities in hematopoietic cell transplantation in the United States
    Statistic
    Black patients are less likely to proceed to transplant and have worse outcomes, partly due to lower match availability and longer search times
    Excerpt
    “"Whites constitute nearly 6.5 million (74%) donors in the registry, whereas the representation of Hispanics (10%), Blacks (7%) and Asians (7%) is less frequent. This underrepresentation compounds the biological challenge of greater HLA diversity in non-White populations." ”
    Source data from
    2013-11-01
    Accessed
    2026-04-18 · archived copy
    Calculation
    This review contextualizes the match-rate disparity within the broader transplant pipeline. Lower match probability leads to longer search times, which leads to disease progression, which leads to worse outcomes or ineligibility for transplant. The disparity is not purely a registry-size problem — HLA diversity means that even a proportionally representative registry would yield lower match rates for Black patients unless the registry were substantially larger overall.

412 risks with measured probability
1 in 10 1 in 100 1 in 1K 1 in 10K 1 in 100K 1 in 1M 1 in 10M 1 in 100M 1 in 1B certain rarer → Cosmetic surgery abroad risk — 1 in 10 Infant sugar/salt and adult disease — 1 in 10 Endometriosis — 1 in 10 Hair transplant Turkey risk — 1 in 10 Knee replacement — 1 in 10 Chronic painkillers — 1 in 10 Elderly abandonment — 1 in 9.1 Complete tooth loss — 1 in 9.1 Alzheimer's — 1 in 8.3 Sleep deprivation — 1 in 8.3 Smokeless tobacco — 1 in 8.3 Cycling w/o helmet — 1 in 8.0 Bruxism tooth damage — 1 in 7.7 Vision loss — 1 in 6.7 Hernia from lifting — 1 in 6.7 Hip fracture risk — 1 in 6.7 Regular drinking — 1 in 6.7 First heart attack — 1 in 5.9 Infertility — 1 in 5.7 5+ years paid LTC — 1 in 5.6 CTE (football) — 1 in 5.0 Major depression — 1 in 4.9 Hiking injury — 1 in 4.8 Infection from sharing food with child — 1 in 4.2 Lyme disease — 1 in 4.0 Loneliness & health — 1 in 3.8 Job loss & depression — 1 in 3.7 Inheriting AUD risk — 1 in 3.5 Alcohol use disorder — 1 in 3.4 Menopause CV risk acceleration — 1 in 3.0 Silent diabetes — 1 in 3.0 Flying with cold — 1 in 2.9 Tick illness (forest) — 1 in 2.9 Silent high cholesterol — 1 in 2.9 Grandparent loss in childhood — 1 in 2.8 Pacifier floor drop — 1 in 2.8 Drug-resistant infection — 1 in 2.6 No marrow match — 1 in 2.4 Nursing home admission — 1 in 2.2 Skipping dental checkups — 1 in 2.1 False-positive mammogram — 1 in 2.0 Regular smoking — 1 in 2.0 Travelers' diarrhea — 1 in 2.0 Adventure sports — 1 in 1.8 Family caregiver probability — 1 in 1.8 LTC need after 65 — 1 in 1.8 Widowhood probability — 1 in 1.7 Unprotected sex — 1 in 1.5 Silent hypertension — 1 in 1.3 Chronic back pain — 1 in 1.3 Hand hygiene — 1 in 1.0 Cancer (any) — 1 in 7.1 E-scooter no helmet — 1 in 4.5 E-bike no helmet — 1 in 4.0 Mishandled luggage — 1 in 3.7 Deer collision — 1 in 2.7 At-fault injury crash — 1 in 2.5 Flight cancellation — 1 in 1.8 Trip disruption: war or disaster — 1 in 1.7 Home burglary (global) — 1 in 9.1 Hitchhiking assault — 1 in 8.8 Mail check fraud — 1 in 7.7 Child sexual abuse — 1 in 6.8 Stalking — 1 in 6.2 Student sexual assault — 1 in 5.7 Domestic violence — 1 in 3.7 Night walk assault — 1 in 3.6 Bicycle theft — 1 in 2.9 Sexual assault — 1 in 2.9 Home burglary — 1 in 2.6 Sexual harassment (lifetime) — 1 in 1.6 Water scarcity — 1 in 2.5 Carrington-class solar storm — 1 in 1.9 WAIS tipping point — 1 in 1.1 Indoor cat escape harm — 1 in 10 Off-leash dog bite — 1 in 8.9 Rabbit dies in 4 years — 1 in 3.3 Dog bite (non-fatal) — 1 in 1.8 Hamster dies before teenager — 1 in 1.0 Vitamin D gap — 1 in 2.9 Undercooked food — 1 in 1.6 Raw meat cross-contamination — 1 in 1.4 Food left out — 1 in 1.2 AI voice scam — 1 in 2.9 Online scam loss — 1 in 2.5 Teen cyberbullying — 1 in 2.0 Kids & explicit content — 1 in 1.9 Data breach — 1 in 1.1 Miscarriage — 1 in 6.7 Teen suicide attempt — 1 in 5.6 Postpartum depression — 1 in 4.8 Painkiller before infant vaccination — 1 in 3.8 Excessive pregnancy weight — 1 in 2.6 Unvaxxed child & measles — 1 in 2.0 Elder fraud loss — 1 in 10 Pension fund collapse — 1 in 10 Personal bankruptcy — 1 in 10 Housing crash — 1 in 8.3 Crypto total loss — 1 in 6.7 IRS audit — 1 in 6.7 Visa overstay deportation — 1 in 5.6 Long term disability working age — 1 in 4.0 Student loan default — 1 in 3.8 Whistleblower retaliation — 1 in 3.2 Career obsolescence — 1 in 2.9 Forced job exit before retirement — 1 in 2.9 Retirement shortfall — 1 in 2.6 Divorce — 1 in 2.4 Burst pipe damage — 1 in 2.2 Workplace bullying — 1 in 2.1 Deportation (undocumented) — 1 in 1.8 Funeral cost shock — 1 in 1.8 Identity theft — 1 in 1.7 Credit card fraud — 1 in 1.5 School bullying — 1 in 1.5 Insurance claim denial — 1 in 1.4 Frontline soldier casualty — 1 in 1.3 Economic recession — 1 in 1.0 Stock market crash — 1 in 1.0 Hail roof damage — 1 in 3.0 Dry toilet paper harm — 1 in 100 Secondhand smoke — 1 in 91 Gaming disorder (adults) — 1 in 83 High-heel ER visit — 1 in 79 Child throwing object — 1 in 67 Medication reaction — 1 in 58 Cat litter toxoplasmosis — 1 in 48 Mental health LTD claim — 1 in 45 Drug overdose — 1 in 42 Benzo dependence — 1 in 40 Tap water lead — 1 in 40 Medication misuse — 1 in 35 Traumatic brain injury — 1 in 33 Hospital infection — 1 in 31 Air pollution — 1 in 29 End-stage kidney disease — 1 in 29 Traveler's diarrhea (water) — 1 in 26 Skiing injury — 1 in 26 Bipolar disorder — 1 in 23 Dental tourism complication — 1 in 20 Pet parasites — 1 in 20 Undiagnosed ADHD — 1 in 20 Adult-onset food allergy — 1 in 19 Indoor cooking smoke — 1 in 18 Non-Alzheimer's dementia — 1 in 17 Working-age disabling stroke — 1 in 17 Cannabis use disorder — 1 in 16 Stroke — 1 in 15 Parent death/disability — 1 in 14 Severe hearing loss — 1 in 14 Type 2 diabetes — 1 in 13 Appendicitis — 1 in 13 Untreated depression — 1 in 13 Untreated back pain disability — 1 in 13 Heart disease — 1 in 12 Medical error death — 1 in 12 Compulsive sexual behavior — 1 in 12 Eating disorder — 1 in 11 Hip replacement — 1 in 11 Kidney stones — 1 in 11 Sedentary lifestyle — 1 in 11 Salon infection — 1 in 11 Ovarian cancer — 1 in 91 Colorectal cancer — 1 in 77 Breast cancer — 1 in 59 Liver cancer — 1 in 59 Lung cancer — 1 in 56 Prostate cancer — 1 in 50 Melanoma (UV) — 1 in 29 Low-fiber CRC risk — 1 in 23 Red meat & CRC — 1 in 21 Charred meat & cancer — 1 in 20 Maintenance crash — 1 in 83 Driving on sedating meds — 1 in 77 Texting + driving — 1 in 56 Driving after cannabis — 1 in 53 Eating while driving — 1 in 53 Unbelted crash death — 1 in 53 Speeding 20% over limit — 1 in 48 Motorcycle no helmet — 1 in 45 Spaceflight (astronaut) — 1 in 42 Video watching + driving — 1 in 32 Drowsy driving — 1 in 26 E-scooter injury — 1 in 26 Cruise ship norovirus — 1 in 24 Driving at 0.10% BAC — 1 in 16 Catalytic converter theft — 1 in 83 Pickpocketed while traveling — 1 in 38 Stabbed in an assault — 1 in 37 Vehicle theft — 1 in 34 Street robbery / mugging — 1 in 26 Wrongful conviction — 1 in 24 Drink spiking — 1 in 17 Protest under autocracy — 1 in 12 AMOC collapse — 1 in 20 Sting anaphylaxis — 1 in 50 Cat collar injury — 1 in 25 Fish bone injury — 1 in 68 Restaurant food poisoning — 1 in 58 Vegetarian deficiency — 1 in 25 Intimate deepfake — 1 in 25 Social media problematic use — 1 in 13 Infant fall — 1 in 100 Childbirth death (SSA) — 1 in 55 Co-sleeping death — 1 in 43 Toddler stair fall — 1 in 37 Play swing & slide injury — 1 in 33 Autism diagnosis — 1 in 31 C-section complications — 1 in 29 Toy injury requiring ER (child) — 1 in 21 Preeclampsia — 1 in 20 Severe birth tearing — 1 in 17 Gestational diabetes — 1 in 13 Child fall head injury — 1 in 12 Sports betting financial ruin — 1 in 100 Fighter pilot death — 1 in 48 Commercial fishing career death — 1 in 45 Logging career death — 1 in 34 Dying without heir — 1 in 33 Medical bankruptcy — 1 in 25 Compulsive buying disorder — 1 in 20 Rental listing scam loss — 1 in 20 Mortgage foreclosure — 1 in 14 Musculoskeletal LTD claim — 1 in 14 Day-trading losses — 1 in 13 Extremist govt catastrophe — 1 in 13 Hurricane home destruction — 1 in 17 LASIK complications — 1 in 1,000 Infant pool submersion — 1 in 800 MS — 1 in 769 Workplace fatality — 1 in 690 Typhoid fever — 1 in 654 Unsafe imported products — 1 in 565 Brain aneurysm — 1 in 400 COVID-19 — 1 in 400 Fireworks injury — 1 in 385 Sickle cell disease — 1 in 365 Counterfeit medicine — 1 in 361 Spinal cord injury — 1 in 313 Childhood cancer diagnosis — 1 in 285 Next pandemic death — 1 in 208 Dengue (travel) — 1 in 200 Skipping daily showers — 1 in 200 Not scrubbing feet — 1 in 200 Marrow donation risk — 1 in 167 Schizophrenia — 1 in 143 Accidental fall — 1 in 135 Parkinson's — 1 in 125 Sudden death during exercise — 1 in 123 Suicide (US) — 1 in 121 Opioid addiction — 1 in 114 Tuberculosis (global) — 1 in 108 Radon cancer — 1 in 435 Testicular cancer — 1 in 250 Cervical cancer — 1 in 167 Pancreatic cancer — 1 in 125 Pedestrian death — 1 in 806 Motorcycle crash — 1 in 694 Boating drowning — 1 in 685 Driver kills pedestrian — 1 in 552 Phone-distracted walking injury — 1 in 400 EV battery fire — 1 in 333 Cyclist killed by car — 1 in 196 Hand-held phone call + driving — 1 in 143 Petrol car fire — 1 in 125 Self-driving car fatality — 1 in 115 Car crash — 1 in 105 Firefighter duty death — 1 in 455 Police duty death — 1 in 313 Homicide — 1 in 287 Pig-butchering scam — 1 in 106 Extreme heat — 1 in 333 Climate change death — 1 in 204 Swallowed bee/wasp — 1 in 500 Bat bite & rabies — 1 in 238 Mosquito-borne disease — 1 in 190 Food poisoning (global) — 1 in 317 Solar panel fire — 1 in 667 Untreated childhood scoliosis — 1 in 1,000 Child window fall — 1 in 855 Walker stair fall — 1 in 625 Baby walker injury — 1 in 455 Maternal mortality — 1 in 272 Untreated childhood flat feet — 1 in 250 Maternal age & birth defects — 1 in 200 Child death (<18) — 1 in 143 Caving career death — 1 in 167 EMS duty death — 1 in 794 Civilian war casualty — 1 in 499 Soldier in combat — 1 in 270 Mining career death — 1 in 214 Gambling financial ruin — 1 in 159 Wildfire home destruction — 1 in 120 Lightning home fire — 1 in 105 Malaria (travel) — 1 in 10,000 Infection from shared drink — 1 in 10,000 Chagas disease — 1 in 8,475 Wild berry fox tapeworm — 1 in 8,475 Schistosomiasis death — 1 in 6,667 Sudden death (young adult) — 1 in 3,922 Unsafe wiring — 1 in 3,390 Sepsis from wound — 1 in 2,857 Anesthesia awareness — 1 in 2,500 Heat stroke (outdoor) — 1 in 1,905 House fire — 1 in 1,818 Rabies from dogs — 1 in 1,449 Drowning — 1 in 1,379 Shallow-water diving SCI — 1 in 1,111 Choking — 1 in 1,099 EVALI vaping hospitalization — 1 in 1,064 Betel nut cancer — 1 in 1,290 Blood clot (flight) — 1 in 4,651 Killing a cyclist — 1 in 3,937 Teen road-crash death — 1 in 3,030 Child rear bike seat — 1 in 2,500 Child without restraint — 1 in 2,000 Fatal police encounter — 1 in 4,739 Honor killing — 1 in 2,381 Intimate-partner homicide — 1 in 1,767 Hurricane — 1 in 8,929 Drought famine death — 1 in 6,536 Blizzard death — 1 in 4,367 Earthquake — 1 in 3,802 Dog chocolate death — 1 in 2,000 Food poisoning (US) — 1 in 1,862 Fish mercury — 1 in 1,695 Phone/laptop battery fire — 1 in 1,136 SIDS — 1 in 7,143 Laundry pod ingestion — 1 in 6,494 Untreated infant hip dysplasia — 1 in 5,000 Pool drowning — 1 in 2,299 War (civilian) — 1 in 2,000 Fatal bee/wasp sting — 1 in 76,923 Anesthesia death — 1 in 50,000 Dog hot car death — 1 in 41,667 Anaphylaxis — 1 in 27,548 Chiropractic neck manipulation — 1 in 16,667 CO poisoning — 1 in 14,006 Hepatitis A (travel) — 1 in 12,500 Skipping allergy immunotherapy — 1 in 11,111 Acrylamide & cancer — 1 in 16,667 Bus crash — 1 in 100,000 Plane crash — 1 in 58,824 Child pedestrian (residential) — 1 in 45,455 Railroad crossing death — 1 in 20,704 Child bike trailer — 1 in 14,286 Acid attack — 1 in 89,286 Terrorism — 1 in 77,519 Child stranger abduction — 1 in 38,760 Stranger kidnapping — 1 in 35,211 Dowry death — 1 in 13,158 Accidental gun death — 1 in 11,299 Wildfire — 1 in 100,000 Tornado — 1 in 80,645 Tsunami — 1 in 52,632 Ocean drowning — 1 in 29,155 Flood — 1 in 20,202 Landslide death — 1 in 18,416 Supervolcano eruption — 1 in 12,376 Crocodile attack — 1 in 84,746 Bee sting — 1 in 78,927 Fatal scorpion sting — 1 in 26,110 Plastic container leaching — 1 in 16,949 Infant in car seat — 1 in 64,935 Bouncer chair fall — 1 in 60,606 Toddler choking — 1 in 50,000 Unsupervised infant choking — 1 in 50,000 Magnet ingestion — 1 in 12,048 Snorkeling death — 1 in 21,739 Pet in transport — 1 in 20,000 Landmine or UXO injury — 1 in 14,728 Vaccine reaction — 1 in 763,359 Aluminum & Alzheimer's — 1 in 169,492 Residential gas leak — 1 in 140,845 Child hot car death — 1 in 102,041 Glyphosate & cancer — 1 in 1,000,000 Teflon cookware cancer — 1 in 169,492 Roller coaster injury — 1 in 312,500 Cruise ship accident — 1 in 188,679 Ferry sinking — 1 in 133,333 Turbulence injury — 1 in 114,943 School shooting — 1 in 192,308 Mass shooting — 1 in 113,636 Nuclear accident — 1 in 833,333 Avalanche — 1 in 210,526 Lightning — 1 in 209,205 Snake bite — 1 in 884,956 Spider bite — 1 in 833,333 Hippo attack — 1 in 564,972 Dog bite — 1 in 142,045 Pesticide residue — 1 in 1,000,000 Dirty can illness — 1 in 200,000 PLA bioplastic harm — 1 in 169,492 Charger left plugged in — 1 in 200,000 Infant swing death — 1 in 714,286 Child blind cord strangulation — 1 in 416,667 Child plastic bag suffocation — 1 in 263,158 Button battery — 1 in 250,000 Inclined sleeper death — 1 in 238,095 Elevator/escalator death — 1 in 188,324 Japanese encephalitis (travel) — 1 in 2,000,000 Kid + front airbag — 1 in 10,000,000 Asteroid impact — 1 in 1,351,351 Banana spider eggs — 1 in 10,000,000 Shark attack — 1 in 5,681,818 Bear attack — 1 in 3,787,879 Wild berry poisoning — 1 in 2,222,222 Space debris hits property — 1 in 10,000,000 Piranha attack — 1 in 135,135,135 Phone at gas pump — 1 in 1,000,000,000 Phone on plane — 1 in 1,000,000,000 Alien contact — 1 in 169,491,525
Lottery jackpot 1 in 95,238