What are the odds of a major housing market crash wiping out your home equity?
Evidence quality 4.63/5
Eight-dimension review score against the quality rubric . Each dimension scored 1–5.
- D1 Source grounding
- 5/5
- D2 Source authority
- 5/5
- D3 Arithmetic
- 4/5
- D4 Uncertainty
- 4/5
- D5 Scope
- 4/5
- D6 Prose
- 5/5
- D7 Perception honesty
- 5/5
- D8 Caveat completeness
- 5/5
Lifetime probability · lifetime, US adult
1 in 8.3
12% lifetime chance
Most people overestimate this.
range 1 in 20 to 1 in 4.0
● your factors — click this risk ▾ to reveal
≈ As likely as

Perceived
The 2008 financial crisis left a deep imprint on American risk perception. A 2024 Clever Real Estate survey found that 70% of Americans fear an imminent housing market crash, and Gallup polling consistently shows that roughly seven in ten adults consider it a "bad time to buy a house." The availability heuristic is doing heavy lifting here: the 2008 collapse was the most televised financial disaster in history, and it anchored an entire generation's model of what housing markets do. Most people, when asked, treat a >20% national price decline as something that happens roughly once a decade. The actual frequency is closer to once every 30-50 years.
Rough estimate: most people treat a major crash as a once-per-decade event
Source: Clever Real Estate (2024) — 70% of Americans Fear an Imminent Housing Market Crash
Actual
~23% of mortgaged homes were underwater at peak (Q1 2012, US)
US mortgaged homeowners during worst modern crash
Show derivation
The probability combines two components: (1) the frequency of major national housing crashes (>20% decline) and (2) the share of homeowners who actually lose substantial equity during such an event. The US has experienced roughly 3 national-level housing price declines >20% in the past century (1929-33, arguably 1989-97 in real terms, and 2006-12). Over a 59-year adult life, a homeowner who owns for ~30 years has roughly a 60-70% chance of living through at least one such event. During the 2006-12 crash (the worst in 80 years), about 23% of mortgaged properties went underwater (CoreLogic Q1 2012). But most homeowners who bought before the bubble or had substantial equity were not wiped out. Combining the ~65% chance of experiencing a major crash with the ~20-25% conditional probability of equity destruction during such an event gives roughly 0.13-0.16. However, structural reforms since 2008 (qualified mortgage rules, higher lending standards, stress testing) reduce the prospective probability. The 0.12 central estimate reflects a modest downward adjustment for post-GFC regulatory changes. The wide uncertainty band (0.05-0.25) reflects genuine disagreement about whether a 2008-scale event can recur under current regulations.
Caveats: The 12% lifetime estimate is genuinely uncertain because it depends on the frequ…
The 12% lifetime estimate is genuinely uncertain because it depends on the frequency of tail events for which we have only 2-3 data points in US history. The calculation treats the 2008 GFC as representative of a "major crash," but it was arguably a once-per-century event driven by specific institutional failures (subprime securitization, ratings fraud, excessive leverage). Post-crisis reforms — qualified mortgage rules, stress testing, higher capital requirements — were specifically designed to prevent a repeat. If those reforms hold, the true probability is closer to the low end of the uncertainty band. If they erode or new fragilities emerge, the high end applies. The number also pools all homeowners; a renter has zero exposure, and a homeowner with 50% equity and a fixed-rate mortgage in a stable market has near-zero exposure even during a severe crash.
Regional breakdown
The headline figure averages across very different populations. Here’s how the probability varies by geography or context:
| Region / context | Lifetime probability | Notes |
|---|---|---|
| National average (all mortgaged homeowners) | 1 in 8.3 |
Central estimate; assumes ~30-year ownership and one major crash per adult lifetime |
| Speculative bubble markets (Las Vegas, Phoenix, Miami) | 1 in 3.3 |
During 2006-12: 48-61% underwater in these metros. Higher frequency of regional booms/busts. |
| Stable Midwest/Northeast metros | 1 in 25 |
Markets like Pittsburgh, Buffalo, Indianapolis saw <10% declines even in 2008; less volatile historically |
Risks at similar odds
Other risks with roughly the same likelihood — useful for calibration.


Medical bankruptcy
What are the odds of going bankrupt or suffering severe financial hardship due to medical bills?

Career obsolescence
What are the odds of needing to change careers due to technological disruption?


Extremist govt catastrophe
What are the odds of a political extremist government catastrophically ruining your country?
Recently viewed on this device
Stored locally — clear anytime.
Pick challenger
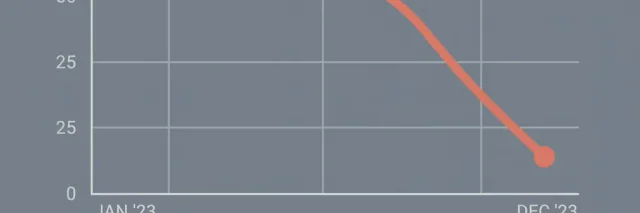
The US has experienced roughly three national-level housing price declines exceeding 20% in the past century: the Great Depression (1929-33, when prices fell an estimated 26-38%), and the 2006-12 financial crisis (when the S&P/Case-Shiller National Index fell approximately 27% peak to trough). The early-1990s downturn was largely regional, concentrated in coastal metros, with national real prices declining about 14% over eight years. During the worst modern crash, CoreLogic reported that 23% of mortgaged US homes were underwater at the peak of negative equity in early 2012, with staggering regional variation: 61% in Nevada, 48% in Arizona, but single digits in stable Midwest markets. Combining the frequency of major crashes (~2-3 per century) with the conditional probability of equity destruction during one yields a lifetime estimate of roughly 1 in 8 for a typical US adult homeowner.
The perception gap here is instructive. A Clever Real Estate survey found 70% of Americans fear an imminent housing crash, and Gallup consistently reports that roughly seven in ten adults consider it a bad time to buy. The 2008 collapse was so vivid and so widely covered that it anchored an entire generation’s mental model of what housing markets do. But national crashes of that magnitude are among the rarest economic events in the data — roughly one every 30-50 years. The 1990s “crash” was not national. The 1930s crash required a depression. The 2008 crash required a specific confluence of subprime lending, securitization fraud, and systemic leverage that current regulations (qualified mortgage rules, Dodd-Frank stress testing, higher capital requirements) were explicitly designed to prevent. Regional declines of 10-20% are more frequent but far less destructive to homeowners with reasonable equity.
Where the number matters most: leverage. A homeowner who bought at the 2006 peak with a 3% down payment on an adjustable-rate mortgage in Las Vegas was almost certain to go underwater. A homeowner who bought in 2001 with 20% down on a fixed-rate mortgage in Pittsburgh was almost certainly fine, even at the bottom. The median US household holds roughly two-thirds of its net worth in home equity (Federal Reserve SCF 2022), which means a housing crash hits the middle class disproportionately hard compared to wealthier households diversified into equities and private business. The national recovery took about ten years: the Case-Shiller National Index did not regain its 2006 peak until late 2016. Some individual metros took longer. The lifetime probability of equity wipeout is real but heavily concentrated among leveraged buyers in speculative markets who purchase near the peak of a cycle.
Related tidbits
About 7% of US mortgages will end in foreclosure over a lifetime. A 2008-scale housing crash has ~12% lifetime odds. Foreclosure fear runs higher than the base rate, even in downturns.
If you invest for a full career, a major stock market crash is near-certain (~99% lifetime). A housing crash comparable to 2008 has about a 12% lifetime probability. One is inevitable; the other is uncommon.
Claim ledger
Every number below is what each source reported, with the verbatim quote we relied on and how we arrived at our figure. Click any link to verify directly.
-
[1] Federal Reserve Bank of St. Louis (FRED) — S&P CoreLogic Case-Shiller U.S. National Home Price Index (CSUSHPINSA)
S&P CoreLogic Case-Shiller U.S. National Home Price Index (CSUSHPINSA)- Statistic
The S&P/Case-Shiller U.S. National Home Price Index declined approximately 27% from its peak in Q1 2006 to its trough in Q1 2012; the 10-city composite fell ~35%.- Excerpt
“"The S&P CoreLogic Case-Shiller U.S. National Home Price Index measures the value of the residential real estate market by tracking changes in the value of residential real estate both nationally and in 20 metropolitan regions." ”
- Source data from
- 2025-12-31
- Accessed
- 2026-04-19 · archived copy
- Calculation
- The Case-Shiller National Home Price NSA Index peaked at approximately 184.6 in Q2 2006 and troughed at approximately 134 in Q1 2012, a decline of roughly 27%. The 10-city and 20-city composites, which overweight bubble metros, fell further (~33-35%). Individual metros saw even larger declines: Las Vegas -55%, Phoenix -51%, Miami -47%. This is the definitive long-run US home price series, used as the foundation for the frequency-of-crashes calculation. Over the index's history (1987-present) plus pre-index academic reconstructions, roughly 3 national >20% declines have occurred in 100 years.
-
[2] CoreLogic (via PR Newswire) — CoreLogic Reports Negative Equity Increase in Q4 2011
CoreLogic Reports Negative Equity Increase in Q4 2011- Statistic
11.1 million mortgaged residential properties (22.8%) were in negative equity at end of Q4 2011.- Excerpt
“"11.1 million, or 22.8 percent, of all residential properties with a mortgage were in negative equity at the end of the fourth quarter of 2011. Nevada had the highest negative equity percentage with 61 percent of all of its mortgaged properties underwater, followed by Arizona (48 percent), Florida (44 percent)." ”
- Source data from
- 2012-03-01
- Accessed
- 2026-04-19 · archived copy
- Calculation
- CoreLogic's negative equity report provides the conditional probability: given that a major national crash occurs, what share of mortgaged homeowners actually lose their equity? The answer at peak was ~23-24% nationally, with enormous regional variation (61% in Nevada vs single digits in stable markets). This is the key input for converting "crash frequency" into "personal equity loss probability." The lifetime estimate multiplies crash frequency (~65% chance of experiencing one in a 30-year ownership span) by conditional equity-loss probability (~20-25%), giving ~12-16%.
- Independence
- CoreLogic's property-level data is independent of the Case-Shiller index methodology. Case-Shiller measures price changes via repeat sales; CoreLogic compares current estimated value to outstanding mortgage balance. They measure different things and draw from different data pipelines.
-
[3] Board of Governors of the Federal Reserve System — Changes in U.S. Family Finances from 2019 to 2022: Evidence from the Survey of Consumer Finances
Changes in U.S. Family Finances from 2019 to 2022: Evidence from the Survey of Consumer Finances- Statistic
Primary residence equity constitutes roughly two-thirds of wealth for the median US household; median net worth rose 37% from 2019 to 2022, largely driven by home equity gains.- Excerpt
“"The typical household is far more concentrated in home equity and retirement savings, with limited exposure to stocks or private business ownership. From 2019 to 2022, public equities and home equity grew as a share of the average household balance sheet." ”
- Source data from
- 2023-10-01
- Accessed
- 2026-04-19 · archived copy
- Calculation
- The Fed SCF establishes why housing crashes matter disproportionately: for the median household, home equity IS wealth. A 27% national price decline translates to a much larger percentage loss of net worth for leveraged homeowners because housing is typically 65-70% of total household wealth at the median. This amplification effect is why housing crashes feel catastrophic even when the absolute price decline is moderate compared to equity market drawdowns.
- Independence
- The SCF is a triennial household survey conducted by the Federal Reserve, entirely independent of both the Case-Shiller price index and CoreLogic's property-level data.