Skip to content
Likelier
Kids · reviewed 2026-04-26

What are the odds of lasting harm from not treating childhood flat feet?

Evidence quality 4.5/5

Eight-dimension review score against the quality rubric . Each dimension scored 1–5.

D1 Source grounding
3/5
D2 Source authority
5/5
D3 Arithmetic
5/5
D4 Uncertainty
4/5
D5 Scope
5/5
D6 Prose
5/5
D7 Perception honesty
4/5
D8 Caveat completeness
5/5
Average 4.5/5
Direct evidence

Lifetime probability · lifetime, US adult

1 in 250

0.4% lifetime chance

Most people overestimate this.

range 1 in 500 to 1 in 125

lifetime, US adult each band = 10× rarer → zoomed to your factors See full scale →
certain 1 in 1K 1 in 1M 1 in 1B
1 in 25 1 in 250

● your factors — click this risk ▾ to reveal

≈ As likely as

A small pair of children's shoes sitting unused next to a pair of orthotic insoles, flat vector illustration in muted earth tones.

Perceived

Flat feet in children provoke an outsized parental anxiety cycle, sustained in part by a large orthotic and insole industry. Pediatric shoe inserts are a multi-billion-dollar global market, and many parents report being told by clinicians — or by shoe-store staff — that flat arches require immediate correction to prevent lifelong disability. Surveys of parental concern find that flat feet are among the top musculoskeletal reasons for pediatric orthopedic referral, despite the condition being overwhelmingly benign. The implicit fear is that an untreated flat foot will lead to chronic pain, gait abnormalities, or arthritis in adulthood.

Rough estimate: Many parents believe untreated flat feet will cause lifelong pain or disability

Source: editorial intuition, not polled

Actual

~1-2% of children with flat feet develop symptomatic problems persisting into adulthood

Children diagnosed with flexible flat feet, tracked to adulthood

Show derivation

Approximately 20-30% of adults have flat feet (pes planus). The vast majority are asymptomatic. StatPearls reports flat feet prevalence of 54% in 3-year-olds, 26% in 6-year-olds, and ~15% in adolescents over 10 — confirming that most childhood flat feet self-resolve. Among adults with persistent flat feet, studies report that only 1-2% are symptomatic (i.e., experience pain or functional limitation attributable to the flat arch itself rather than comorbidities). Applying 1.5% symptomatic rate to the ~26% of the population that retains flat feet into adulthood yields roughly 0.4% of the general adult population with symptomatic flat-foot-related impairment. This is an upper bound, as it does not distinguish untreated from treated flat feet — and the Cochrane 2022 review found no evidence that orthotic intervention alters the natural history. Compounding is not applicable here; this is a prevalence-based lifetime estimate rather than a hazard rate.

Caveats: This entry covers flexible (physiologic) flat feet in otherwise healthy children…

This entry covers flexible (physiologic) flat feet in otherwise healthy children. Rigid flat feet, flat feet secondary to tarsal coalition, and flat feet associated with neuromuscular conditions (e.g., cerebral palsy, Ehlers-Danlos syndrome) are distinct clinical entities with different prognoses and are not covered here. The 1-2% symptomatic figure from StatPearls does not distinguish between pain caused by the arch itself and pain from comorbid conditions (obesity, hypermobility) that are correlated with flat feet. Progressive collapsing foot deformity (adult- acquired flat foot from posterior tibial tendon dysfunction) is a separate condition that occurs in middle-aged adults and is not a consequence of untreated childhood flat feet.

Risks at similar odds

Other risks with roughly the same likelihood — useful for calibration.

kids

Child death (<18)

What are the odds of a child dying before age 18 in the US?

kids

Maternal age & birth defects

What are the odds of a baby having a chromosomal disorder based on parental age?

kids

Baby walker injury

What are the odds an infant in a baby walker is treated in the emergency department for a walker-related injury?

kids

Walker stair fall

What are the odds an infant in a baby walker falls down a flight of stairs?

kids

Infant fall

What are the odds of serious injury when an infant falls from furniture (sofa, bed, changing table)?

kids

Maternal mortality

What are the odds of dying from pregnancy-related causes?

kids

Untreated childhood scoliosis

What are the odds of serious disability from untreated childhood scoliosis?

Health

Not scrubbing feet

What are the odds of getting a foot infection from not washing your feet in the shower?

Compare to:

Flat feet are among the most common reasons for pediatric orthopedic referral, yet the evidence base for treating them is remarkably thin. The Cochrane Collaboration’s 2022 review of 16 randomized trials covering 1,058 children found that neither customized nor prefabricated foot orthoses produced significant improvements in pain, function, or quality of life compared with shoes alone. The American Academy of Family Physicians’ Choosing Wisely campaign explicitly recommends against ordering custom orthotics for asymptomatic or minimally symptomatic flat feet in children, noting that orthotic devices do not aid arch development. The arch develops spontaneously in the vast majority of children between ages 2 and 10 — prevalence drops from 54% at age 3 to 26% at age 6 — and the roughly 20% of adults who retain flat feet are overwhelmingly asymptomatic.

The gap between clinical reality and parental anxiety is driven in part by a global orthotic industry worth several billion dollars annually. StatPearls reports that 10% of American children with flat feet receive orthotics, while only 1-2% are actually symptomatic — an overtreatment ratio of at least 5:1. The persistent cultural belief that flat feet inevitably cause problems may trace to military screening practices that excluded flat-footed recruits, a policy abandoned decades ago when studies found no correlation between arch height and injury risk during basic training. The fear that an untreated flat foot in childhood will degrade into chronic pain or disability in adulthood is not supported by longitudinal data; most adults with flat feet report no foot-related functional limitations.

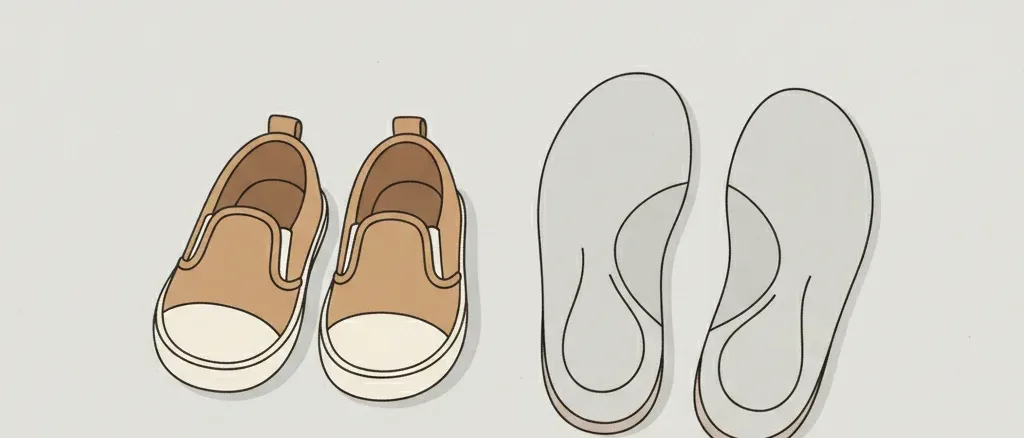
The important clinical distinction is between flexible and rigid flat feet. Flexible flat foot — where the arch appears when the child stands on tiptoe or when the foot is non-weight-bearing — accounts for the overwhelming majority of cases and is considered a normal developmental variant rather than a pathology. Rigid flat foot, which may indicate tarsal coalition or other structural abnormalities, is genuinely pathological but rare (well under 1% of pediatric flat-foot presentations). Progressive collapsing foot deformity in adults, sometimes called adult-acquired flat foot, is caused by posterior tibial tendon dysfunction and is a separate condition that is not a downstream consequence of childhood flat feet. Conflating these distinct entities is one of the mechanisms by which the perceived risk of “doing nothing” about childhood flat feet becomes inflated.

Claim ledger

Every number below is what each source reported, with the verbatim quote we relied on and how we arrived at our figure. Click any link to verify directly.

  1. [1] Cochrane Database of Systematic Reviews — Foot orthoses for treating paediatric flat feet
    Foot orthoses for treating paediatric flat feet
    Statistic
    16 trials, 1058 children: no significant improvement in pain, function, or quality of life from customized or prefabricated foot orthoses
    Excerpt
    “"Customized or prefabricated foot orthoses do not result in significant improvements in pain, function, or parent and child quality-of-life scores." ”
    Source data from
    2022-01-14
    Accessed
    2026-04-18
    Calculation
    The 2022 Cochrane review (Evans et al.) is the definitive synthesis on orthotic intervention for pediatric flat feet. It included 16 RCTs with 1,058 children and found no benefit of orthoses over shoes alone for asymptomatic flexible flat feet. This directly undermines the premise that untreated flat feet lead to worse outcomes — if treatment does not improve outcomes, the untreated natural history is the relevant baseline, and it is overwhelmingly benign.
  2. [2] StatPearls (NCBI Bookshelf) — Pes Planus
    Pes Planus
    Statistic
    Flat feet present in 54% of 3-year-olds, 26% of 6-year-olds; most arches develop by age 6-10; ~20% of adults retain flat feet, majority asymptomatic
    Excerpt
    “"Most babies are flatfooted and the arch elevates spontaneously in the first decade. Whilst 10% of American children with flatfeet are treated with orthotics, only 1-2% were shown to be symptomatic." ”
    Source data from
    2023-08-08
    Accessed
    2026-04-18 · archived copy
    Calculation
    StatPearls provides the prevalence cascade: 54% at age 3, 26% at age 6, ~15-20% persisting into adulthood. The critical finding is the treatment- symptom mismatch: 10% of flat-footed children receive orthotics, but only 1-2% are actually symptomatic. This implies an overtreatment ratio of roughly 5:1 to 10:1 in clinical practice.
  3. [3] AAFP (Choosing Wisely) — Don't order custom orthotics or shoe inserts for a child with minimally symptomatic or asymptomatic flat feet
    Don't order custom orthotics or shoe inserts for a child with minimally symptomatic or asymptomatic flat feet
    Statistic
    AAFP recommends against orthotics for asymptomatic pediatric flat feet as part of its Choosing Wisely campaign
    Excerpt
    “"It is safe and appropriate to simply observe an asymptomatic child with flat feet. The use of custom orthotic devices to provide support for the foot does not aid in the development of the arch." ”
    Source data from
    2023-01-01
    Accessed
    2026-04-18 · archived copy
    Calculation
    The AAFP Choosing Wisely recommendation explicitly advises against orthotics for asymptomatic flat feet. This is notable because Choosing Wisely items are specifically selected to address common practices where evidence of benefit is absent — placing pediatric flat-foot orthotics in the same category as routine imaging for uncomplicated headache.

412 risks with measured probability
1 in 10 1 in 100 1 in 1K 1 in 10K 1 in 100K 1 in 1M 1 in 10M 1 in 100M 1 in 1B certain rarer → Cosmetic surgery abroad risk — 1 in 10 Infant sugar/salt and adult disease — 1 in 10 Endometriosis — 1 in 10 Hair transplant Turkey risk — 1 in 10 Knee replacement — 1 in 10 Chronic painkillers — 1 in 10 Elderly abandonment — 1 in 9.1 Complete tooth loss — 1 in 9.1 Alzheimer's — 1 in 8.3 Sleep deprivation — 1 in 8.3 Smokeless tobacco — 1 in 8.3 Cycling w/o helmet — 1 in 8.0 Bruxism tooth damage — 1 in 7.7 Vision loss — 1 in 6.7 Hernia from lifting — 1 in 6.7 Hip fracture risk — 1 in 6.7 Regular drinking — 1 in 6.7 First heart attack — 1 in 5.9 Infertility — 1 in 5.7 5+ years paid LTC — 1 in 5.6 CTE (football) — 1 in 5.0 Major depression — 1 in 4.9 Hiking injury — 1 in 4.8 Infection from sharing food with child — 1 in 4.2 Lyme disease — 1 in 4.0 Loneliness & health — 1 in 3.8 Job loss & depression — 1 in 3.7 Inheriting AUD risk — 1 in 3.5 Alcohol use disorder — 1 in 3.4 Menopause CV risk acceleration — 1 in 3.0 Silent diabetes — 1 in 3.0 Flying with cold — 1 in 2.9 Tick illness (forest) — 1 in 2.9 Silent high cholesterol — 1 in 2.9 Grandparent loss in childhood — 1 in 2.8 Pacifier floor drop — 1 in 2.8 Drug-resistant infection — 1 in 2.6 No marrow match — 1 in 2.4 Nursing home admission — 1 in 2.2 Skipping dental checkups — 1 in 2.1 False-positive mammogram — 1 in 2.0 Regular smoking — 1 in 2.0 Travelers' diarrhea — 1 in 2.0 Adventure sports — 1 in 1.8 Family caregiver probability — 1 in 1.8 LTC need after 65 — 1 in 1.8 Widowhood probability — 1 in 1.7 Unprotected sex — 1 in 1.5 Silent hypertension — 1 in 1.3 Chronic back pain — 1 in 1.3 Hand hygiene — 1 in 1.0 Cancer (any) — 1 in 7.1 E-scooter no helmet — 1 in 4.5 E-bike no helmet — 1 in 4.0 Mishandled luggage — 1 in 3.7 Deer collision — 1 in 2.7 At-fault injury crash — 1 in 2.5 Flight cancellation — 1 in 1.8 Trip disruption: war or disaster — 1 in 1.7 Home burglary (global) — 1 in 9.1 Hitchhiking assault — 1 in 8.8 Mail check fraud — 1 in 7.7 Child sexual abuse — 1 in 6.8 Stalking — 1 in 6.2 Student sexual assault — 1 in 5.7 Domestic violence — 1 in 3.7 Night walk assault — 1 in 3.6 Bicycle theft — 1 in 2.9 Sexual assault — 1 in 2.9 Home burglary — 1 in 2.6 Sexual harassment (lifetime) — 1 in 1.6 Water scarcity — 1 in 2.5 Carrington-class solar storm — 1 in 1.9 WAIS tipping point — 1 in 1.1 Indoor cat escape harm — 1 in 10 Off-leash dog bite — 1 in 8.9 Rabbit dies in 4 years — 1 in 3.3 Dog bite (non-fatal) — 1 in 1.8 Hamster dies before teenager — 1 in 1.0 Vitamin D gap — 1 in 2.9 Undercooked food — 1 in 1.6 Raw meat cross-contamination — 1 in 1.4 Food left out — 1 in 1.2 AI voice scam — 1 in 2.9 Online scam loss — 1 in 2.5 Teen cyberbullying — 1 in 2.0 Kids & explicit content — 1 in 1.9 Data breach — 1 in 1.1 Miscarriage — 1 in 6.7 Teen suicide attempt — 1 in 5.6 Postpartum depression — 1 in 4.8 Painkiller before infant vaccination — 1 in 3.8 Excessive pregnancy weight — 1 in 2.6 Unvaxxed child & measles — 1 in 2.0 Elder fraud loss — 1 in 10 Pension fund collapse — 1 in 10 Personal bankruptcy — 1 in 10 Housing crash — 1 in 8.3 Crypto total loss — 1 in 6.7 IRS audit — 1 in 6.7 Visa overstay deportation — 1 in 5.6 Long term disability working age — 1 in 4.0 Student loan default — 1 in 3.8 Whistleblower retaliation — 1 in 3.2 Career obsolescence — 1 in 2.9 Forced job exit before retirement — 1 in 2.9 Retirement shortfall — 1 in 2.6 Divorce — 1 in 2.4 Burst pipe damage — 1 in 2.2 Workplace bullying — 1 in 2.1 Deportation (undocumented) — 1 in 1.8 Funeral cost shock — 1 in 1.8 Identity theft — 1 in 1.7 Credit card fraud — 1 in 1.5 School bullying — 1 in 1.5 Insurance claim denial — 1 in 1.4 Frontline soldier casualty — 1 in 1.3 Economic recession — 1 in 1.0 Stock market crash — 1 in 1.0 Hail roof damage — 1 in 3.0 Dry toilet paper harm — 1 in 100 Secondhand smoke — 1 in 91 Gaming disorder (adults) — 1 in 83 High-heel ER visit — 1 in 79 Child throwing object — 1 in 67 Medication reaction — 1 in 58 Cat litter toxoplasmosis — 1 in 48 Mental health LTD claim — 1 in 45 Drug overdose — 1 in 42 Benzo dependence — 1 in 40 Tap water lead — 1 in 40 Medication misuse — 1 in 35 Traumatic brain injury — 1 in 33 Hospital infection — 1 in 31 Air pollution — 1 in 29 End-stage kidney disease — 1 in 29 Traveler's diarrhea (water) — 1 in 26 Skiing injury — 1 in 26 Bipolar disorder — 1 in 23 Dental tourism complication — 1 in 20 Pet parasites — 1 in 20 Undiagnosed ADHD — 1 in 20 Adult-onset food allergy — 1 in 19 Indoor cooking smoke — 1 in 18 Non-Alzheimer's dementia — 1 in 17 Working-age disabling stroke — 1 in 17 Cannabis use disorder — 1 in 16 Stroke — 1 in 15 Parent death/disability — 1 in 14 Severe hearing loss — 1 in 14 Type 2 diabetes — 1 in 13 Appendicitis — 1 in 13 Untreated depression — 1 in 13 Untreated back pain disability — 1 in 13 Heart disease — 1 in 12 Medical error death — 1 in 12 Compulsive sexual behavior — 1 in 12 Eating disorder — 1 in 11 Hip replacement — 1 in 11 Kidney stones — 1 in 11 Sedentary lifestyle — 1 in 11 Salon infection — 1 in 11 Ovarian cancer — 1 in 91 Colorectal cancer — 1 in 77 Breast cancer — 1 in 59 Liver cancer — 1 in 59 Lung cancer — 1 in 56 Prostate cancer — 1 in 50 Melanoma (UV) — 1 in 29 Low-fiber CRC risk — 1 in 23 Red meat & CRC — 1 in 21 Charred meat & cancer — 1 in 20 Maintenance crash — 1 in 83 Driving on sedating meds — 1 in 77 Texting + driving — 1 in 56 Driving after cannabis — 1 in 53 Eating while driving — 1 in 53 Unbelted crash death — 1 in 53 Speeding 20% over limit — 1 in 48 Motorcycle no helmet — 1 in 45 Spaceflight (astronaut) — 1 in 42 Video watching + driving — 1 in 32 Drowsy driving — 1 in 26 E-scooter injury — 1 in 26 Cruise ship norovirus — 1 in 24 Driving at 0.10% BAC — 1 in 16 Catalytic converter theft — 1 in 83 Pickpocketed while traveling — 1 in 38 Stabbed in an assault — 1 in 37 Vehicle theft — 1 in 34 Street robbery / mugging — 1 in 26 Wrongful conviction — 1 in 24 Drink spiking — 1 in 17 Protest under autocracy — 1 in 12 AMOC collapse — 1 in 20 Sting anaphylaxis — 1 in 50 Cat collar injury — 1 in 25 Fish bone injury — 1 in 68 Restaurant food poisoning — 1 in 58 Vegetarian deficiency — 1 in 25 Intimate deepfake — 1 in 25 Social media problematic use — 1 in 13 Infant fall — 1 in 100 Childbirth death (SSA) — 1 in 55 Co-sleeping death — 1 in 43 Toddler stair fall — 1 in 37 Play swing & slide injury — 1 in 33 Autism diagnosis — 1 in 31 C-section complications — 1 in 29 Toy injury requiring ER (child) — 1 in 21 Preeclampsia — 1 in 20 Severe birth tearing — 1 in 17 Gestational diabetes — 1 in 13 Child fall head injury — 1 in 12 Sports betting financial ruin — 1 in 100 Fighter pilot death — 1 in 48 Commercial fishing career death — 1 in 45 Logging career death — 1 in 34 Dying without heir — 1 in 33 Medical bankruptcy — 1 in 25 Compulsive buying disorder — 1 in 20 Rental listing scam loss — 1 in 20 Mortgage foreclosure — 1 in 14 Musculoskeletal LTD claim — 1 in 14 Day-trading losses — 1 in 13 Extremist govt catastrophe — 1 in 13 Hurricane home destruction — 1 in 17 LASIK complications — 1 in 1,000 Infant pool submersion — 1 in 800 MS — 1 in 769 Workplace fatality — 1 in 690 Typhoid fever — 1 in 654 Unsafe imported products — 1 in 565 Brain aneurysm — 1 in 400 COVID-19 — 1 in 400 Fireworks injury — 1 in 385 Sickle cell disease — 1 in 365 Counterfeit medicine — 1 in 361 Spinal cord injury — 1 in 313 Childhood cancer diagnosis — 1 in 285 Next pandemic death — 1 in 208 Dengue (travel) — 1 in 200 Skipping daily showers — 1 in 200 Not scrubbing feet — 1 in 200 Marrow donation risk — 1 in 167 Schizophrenia — 1 in 143 Accidental fall — 1 in 135 Parkinson's — 1 in 125 Sudden death during exercise — 1 in 123 Suicide (US) — 1 in 121 Opioid addiction — 1 in 114 Tuberculosis (global) — 1 in 108 Radon cancer — 1 in 435 Testicular cancer — 1 in 250 Cervical cancer — 1 in 167 Pancreatic cancer — 1 in 125 Pedestrian death — 1 in 806 Motorcycle crash — 1 in 694 Boating drowning — 1 in 685 Driver kills pedestrian — 1 in 552 Phone-distracted walking injury — 1 in 400 EV battery fire — 1 in 333 Cyclist killed by car — 1 in 196 Hand-held phone call + driving — 1 in 143 Petrol car fire — 1 in 125 Self-driving car fatality — 1 in 115 Car crash — 1 in 105 Firefighter duty death — 1 in 455 Police duty death — 1 in 313 Homicide — 1 in 287 Pig-butchering scam — 1 in 106 Extreme heat — 1 in 333 Climate change death — 1 in 204 Swallowed bee/wasp — 1 in 500 Bat bite & rabies — 1 in 238 Mosquito-borne disease — 1 in 190 Food poisoning (global) — 1 in 317 Solar panel fire — 1 in 667 Untreated childhood scoliosis — 1 in 1,000 Child window fall — 1 in 855 Walker stair fall — 1 in 625 Baby walker injury — 1 in 455 Maternal mortality — 1 in 272 Untreated childhood flat feet — 1 in 250 Maternal age & birth defects — 1 in 200 Child death (<18) — 1 in 143 Caving career death — 1 in 167 EMS duty death — 1 in 794 Civilian war casualty — 1 in 499 Soldier in combat — 1 in 270 Mining career death — 1 in 214 Gambling financial ruin — 1 in 159 Wildfire home destruction — 1 in 120 Lightning home fire — 1 in 105 Malaria (travel) — 1 in 10,000 Infection from shared drink — 1 in 10,000 Chagas disease — 1 in 8,475 Wild berry fox tapeworm — 1 in 8,475 Schistosomiasis death — 1 in 6,667 Sudden death (young adult) — 1 in 3,922 Unsafe wiring — 1 in 3,390 Sepsis from wound — 1 in 2,857 Anesthesia awareness — 1 in 2,500 Heat stroke (outdoor) — 1 in 1,905 House fire — 1 in 1,818 Rabies from dogs — 1 in 1,449 Drowning — 1 in 1,379 Shallow-water diving SCI — 1 in 1,111 Choking — 1 in 1,099 EVALI vaping hospitalization — 1 in 1,064 Betel nut cancer — 1 in 1,290 Blood clot (flight) — 1 in 4,651 Killing a cyclist — 1 in 3,937 Teen road-crash death — 1 in 3,030 Child rear bike seat — 1 in 2,500 Child without restraint — 1 in 2,000 Fatal police encounter — 1 in 4,739 Honor killing — 1 in 2,381 Intimate-partner homicide — 1 in 1,767 Hurricane — 1 in 8,929 Drought famine death — 1 in 6,536 Blizzard death — 1 in 4,367 Earthquake — 1 in 3,802 Dog chocolate death — 1 in 2,000 Food poisoning (US) — 1 in 1,862 Fish mercury — 1 in 1,695 Phone/laptop battery fire — 1 in 1,136 SIDS — 1 in 7,143 Laundry pod ingestion — 1 in 6,494 Untreated infant hip dysplasia — 1 in 5,000 Pool drowning — 1 in 2,299 War (civilian) — 1 in 2,000 Fatal bee/wasp sting — 1 in 76,923 Anesthesia death — 1 in 50,000 Dog hot car death — 1 in 41,667 Anaphylaxis — 1 in 27,548 Chiropractic neck manipulation — 1 in 16,667 CO poisoning — 1 in 14,006 Hepatitis A (travel) — 1 in 12,500 Skipping allergy immunotherapy — 1 in 11,111 Acrylamide & cancer — 1 in 16,667 Bus crash — 1 in 100,000 Plane crash — 1 in 58,824 Child pedestrian (residential) — 1 in 45,455 Railroad crossing death — 1 in 20,704 Child bike trailer — 1 in 14,286 Acid attack — 1 in 89,286 Terrorism — 1 in 77,519 Child stranger abduction — 1 in 38,760 Stranger kidnapping — 1 in 35,211 Dowry death — 1 in 13,158 Accidental gun death — 1 in 11,299 Wildfire — 1 in 100,000 Tornado — 1 in 80,645 Tsunami — 1 in 52,632 Ocean drowning — 1 in 29,155 Flood — 1 in 20,202 Landslide death — 1 in 18,416 Supervolcano eruption — 1 in 12,376 Crocodile attack — 1 in 84,746 Bee sting — 1 in 78,927 Fatal scorpion sting — 1 in 26,110 Plastic container leaching — 1 in 16,949 Infant in car seat — 1 in 64,935 Bouncer chair fall — 1 in 60,606 Toddler choking — 1 in 50,000 Unsupervised infant choking — 1 in 50,000 Magnet ingestion — 1 in 12,048 Snorkeling death — 1 in 21,739 Pet in transport — 1 in 20,000 Landmine or UXO injury — 1 in 14,728 Vaccine reaction — 1 in 763,359 Aluminum & Alzheimer's — 1 in 169,492 Residential gas leak — 1 in 140,845 Child hot car death — 1 in 102,041 Glyphosate & cancer — 1 in 1,000,000 Teflon cookware cancer — 1 in 169,492 Roller coaster injury — 1 in 312,500 Cruise ship accident — 1 in 188,679 Ferry sinking — 1 in 133,333 Turbulence injury — 1 in 114,943 School shooting — 1 in 192,308 Mass shooting — 1 in 113,636 Nuclear accident — 1 in 833,333 Avalanche — 1 in 210,526 Lightning — 1 in 209,205 Snake bite — 1 in 884,956 Spider bite — 1 in 833,333 Hippo attack — 1 in 564,972 Dog bite — 1 in 142,045 Pesticide residue — 1 in 1,000,000 Dirty can illness — 1 in 200,000 PLA bioplastic harm — 1 in 169,492 Charger left plugged in — 1 in 200,000 Infant swing death — 1 in 714,286 Child blind cord strangulation — 1 in 416,667 Child plastic bag suffocation — 1 in 263,158 Button battery — 1 in 250,000 Inclined sleeper death — 1 in 238,095 Elevator/escalator death — 1 in 188,324 Japanese encephalitis (travel) — 1 in 2,000,000 Kid + front airbag — 1 in 10,000,000 Asteroid impact — 1 in 1,351,351 Banana spider eggs — 1 in 10,000,000 Shark attack — 1 in 5,681,818 Bear attack — 1 in 3,787,879 Wild berry poisoning — 1 in 2,222,222 Space debris hits property — 1 in 10,000,000 Piranha attack — 1 in 135,135,135 Phone at gas pump — 1 in 1,000,000,000 Phone on plane — 1 in 1,000,000,000 Alien contact — 1 in 169,491,525
Lottery jackpot 1 in 95,238