Skip to content
Likelier
Transport · reviewed 2026-05-31

What are the odds of serious injury to a child riding in a rear-mounted bike seat?

Evidence quality 4.25/5

Eight-dimension review score against the quality rubric . Each dimension scored 1–5.

D1 Source grounding
5/5
D2 Source authority
5/5
D3 Arithmetic
3/5
D4 Uncertainty
3/5
D5 Scope
5/5
D6 Prose
4/5
D7 Perception honesty
4/5
D8 Caveat completeness
5/5
Average 4.25/5

Lifetime probability · lifetime, activity-specific

1 in 2,500

0.04% lifetime chance

Most people overestimate this.

range 1 in 10,000 to 1 in 500

lifetime, activity-specific each band = 10× rarer → zoomed to your factors See full scale →
certain 1 in 1K 1 in 1M 1 in 1B
1 in 500 1 in 8,333

● your factors — click this risk ▾ to reveal

≈ As likely as

An empty rear-mounted child bicycle seat on a parked bike, viewed from a low angle, flat vector illustration in muted tones.

Perceived

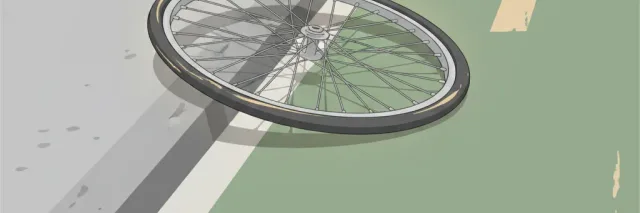
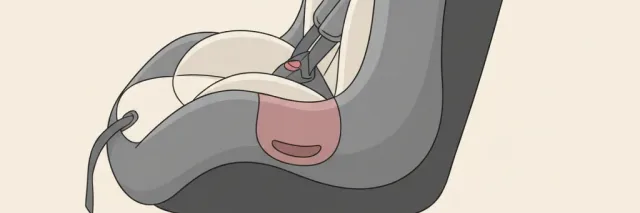
A child in a rear-mounted seat sits visibly exposed, head bobbing above the rear wheel, with no seatbelt around the torso and no metal cage between them and the road. Parents imagine the worst-case scenario as a collision with a car, the child flung from a height onto pavement. Some refuse to use mounted seats at all, citing the absence of crash testing standards comparable to car seats. The fear is a composite of motor-vehicle dread, head-injury salience, and the sense that an adult bicycle is an unstable platform for cargo a parent loves.

Rough estimate: ~5-10% chance of serious injury over a typical childhood as passenger

Source: editorial intuition, not polled

Actual

~2,015 ER-treated injuries over 9 years (NEISS-extrapolated, US children riding in bicycle-mounted child seats)

US children <5 transported as passengers on adult-operated bicycles 1990-1998

Show derivation

Powell & Tanz (2000) extrapolated 2,015 mounted-seat injuries (95% CI 988-3,042) over 9 years (1990-1998) from NEISS sentinel-hospital data. The denominator is the dominant uncertainty: no national survey directly counts US children riding as bicycle passengers. Best estimates from cycling participation surveys put the figure at roughly 5-10% of US children under 5, or ~1-2 million per year, giving ~9-18 million cumulative child-passenger-years over the 9-year window. We use a midpoint of 1.5M cumulative passenger-years, yielding ~0.13% per child-passenger-year, or roughly 1 in 750 per year of exposure. Over a typical 3-year passenger window (ages 1-4), the cumulative ER-treated injury probability is approximately 1 in 2,500. The uncertainty band (1 in 500 to 1 in 10,000) reflects the unknown true exposure denominator and the wide CI on the Powell & Tanz numerator.

Caveats: The 1 in 2,500 headline rests on an unobserved denominator. No US survey directl…

The 1 in 2,500 headline rests on an unobserved denominator. No US survey directly counts how many children ride as bicycle passengers, so the per-exposure rate is a midpoint of plausible bounds rather than a measured quantity. The Powell & Tanz data also pre-dates universal helmet messaging, modern integrated spoke guards, and the CPSC small-parts and tip-resistance standards now baked into compliant mounted seats; a current-day NEISS re-analysis would likely show a lower rate. The number does not capture Northern European cargo-bike or Dutch bakfiets configurations, which sit the child lower and forward and have different crash dynamics. Finally, the 9% motor-vehicle share is the figure most parents intuitively fear, but the absolute risk it represents is small: roughly 1 in 28,000 over a 3-year passenger window.

Risks at similar odds

Other risks with roughly the same likelihood — useful for calibration.

Transport

Child bike trailer

What are the odds of serious injury to a child riding in a towed bicycle trailer?

Transport

Child without restraint

How much more likely is a child to die in a car crash without an appropriate child restraint?

kids

Child window fall

What are the odds of a child being killed or seriously injured by falling from a window or balcony?

Transport

Blood clot (flight)

What are the odds of a serious blood clot after a long-haul flight?

Transport

Killing a cyclist

What are the odds that a driver will kill a cyclist in their lifetime?

Transport

Pedestrian death

What are the odds of being killed as a pedestrian by a motor vehicle?

Transport

Teen road-crash death

How likely is a teenager (15–19) to die in a road-traffic crash during those years?

Transport

Kid + front airbag

What are the odds of a child being killed by a front-seat airbag?

Compare to:

Powell and Tanz (2000) extrapolated about 2,015 ER-treated injuries over nine years among US children riding in bicycle-mounted child seats — roughly 224 per year nationally. Against a denominator of perhaps a million child passengers per year, that works out to a per-passenger-year rate near 1 in 750, or about 1 in 2,500 over a typical three-year window between when a toddler can sit up unaided and when they outgrow the seat. The single most counterintuitive finding: only 9% of injuries involved a motor vehicle. 72% were falls — the bike tipped in a driveway, a parking lot, or a quiet street.

The perceived/actual gap is shaped by what parents picture. The mental image is a car striking the bike. The reality is a parent stopping at a light, forgetting the rear is now top-heavy, and the whole bike toppling sideways onto a curb. Tip-overs are forgiving to adults, who can step out of a fall. A child strapped above the rear wheel cannot. Head and face injuries accounted for 49% of mounted-seat cases — not because the kinetic energy is high, but because the child’s head is the part that hits first.

Where the number does not apply: the Powell & Tanz cohort pre-dates current CPSC small-parts and spoke-guard standards, so modern compliant seats produce fewer entrapment injuries than the 1990s baseline. The data also captures only ER-treated events, not the larger pool of home-managed bruises and the smaller pool of catastrophic motor-vehicle collisions, which produce few cases but heavy individual severity. Cargo-bike configurations common in the Netherlands and Denmark are absent from this dataset, and the under-12-months use that AAP contraindicates carries materially higher risk than the headline figure.

Claim ledger

Every number below is what each source reported, with the verbatim quote we relied on and how we arrived at our figure. Click any link to verify directly.

  1. [1] Archives of Pediatrics & Adolescent Medicine (Powell & Tanz) — Tykes and bikes: injuries associated with bicycle-towed child trailers and bicycle-mounted child seats
    Tykes and bikes: injuries associated with bicycle-towed child trailers and bicycle-mounted child seats

    See all 2 Likelier entries citing this source →

    Statistic
    Estimated 2,015 injuries (95% CI 988-3,042) over 9 years to children riding in US bicycle-mounted child seats; 9% involved motor vehicles, 72% were falls; 49% had head/face injuries
    Excerpt
    “"49 injuries to children during the 9-year study period [were identified]: 6 were associated with bicycle-towed trailers (estimated 322 injuries; 95% CI, 158-486) and 43 were related to bicycle-mounted child seats (estimated 2,015 injuries; 95% CI, 988-3,042). The mean age of injured children was 2.4 years and 51% were male. For trailers, motor vehicle collisions accounted for 33% of injuries and falls 50%; for mounted seats, 9% involved motor vehicles and 72% were falls. Head/face injuries: 83% (trailers) vs 49% (seats)." ”
    Source data from
    2000-04-01
    Accessed
    2026-05-31 · archived copy
    Calculation
    Powell & Tanz analyzed NEISS data for 1990-1998 (9 years). The 2,015 figure is the extrapolated US national estimate from observed cases. We use 2,015 / ~1.5M cumulative child-passenger-years (9 years x ~166k US children riding as passengers/year, estimated from cycling participation surveys) for ~0.13% over the 9-year window, or roughly 1 in 750 per child-passenger-year. Over a typical 3-year exposure window, ~1 in 2,500 for ER-treated injury. The denominator is the dominant uncertainty.
  2. [2] Pediatric Emergency Care (Tanz & Christoffel) — Tykes on bikes: injuries associated with bicycle-mounted child seats
    Tykes on bikes: injuries associated with bicycle-mounted child seats
    Statistic
    Estimated 4,960 mounted-seat injuries over 11 years (1978-1988); falls accounted for 80%; head 51% and face 21% of injuries; spoke entrapment a notable mechanism
    Excerpt
    “"We reviewed US Consumer Product Safety Commission (CPSC) data for 1978-1988... There were an estimated 4960 injuries to children during the 11-year period. The peak age of injury was two years. Fifty-five percent of victims were male. Falls accounted for 80% of the estimated injuries. Head (51%) and face (21%) injuries predominated. Twenty-one percent of estimated injuries were mild, 60% were moderate, and 19% were severe." ”
    Source data from
    1991-10-01
    Accessed
    2026-05-31 · archived copy
    Calculation
    Tanz & Christoffel 1991 covers 1978-1988 (11-year CPSC dataset). Used for mechanism context: falls dominate (80%), head and face injuries dominate (72% combined), and spoke entrapment was a notable pre-standard mechanism. The era pre-dates modern spoke guards (CFR Title 16 Part 1512 and ASTM F1625), so the injury composition is era-anchored and should not be applied directly to current compliant seats.
  3. [3] AAP / HealthyChildren.org — How to Protect Child Passengers on Adult Bikes
    How to Protect Child Passengers on Adult Bikes

    See all 2 Likelier entries citing this source →

    Statistic
    AAP guidance: bike-towed trailers preferred over mounted seats; infants <12 months too young to be passengers; helmets required for both child and adult
    Excerpt
    “"Preferably, children should ride in a bicycle-towed child trailer rather than a bicycle-mounted child seat. Infants younger than 12 months are too young to sit in a rear bike seat or to wear a bicycle helmet." ”
    Source data from
    2024-01-01
    Accessed
    2026-05-31 · archived copy
    Calculation
    AAP positions trailers as the safer of the two passenger configurations without publishing a quantitative differential. This is the cleanest authoritative guidance for the comparison-anchor framing against the trailer entry. Also anchors the under-12-months contraindication used in the personal-factor multipliers.

412 risks with measured probability
1 in 10 1 in 100 1 in 1K 1 in 10K 1 in 100K 1 in 1M 1 in 10M 1 in 100M 1 in 1B certain rarer → Cosmetic surgery abroad risk — 1 in 10 Infant sugar/salt and adult disease — 1 in 10 Endometriosis — 1 in 10 Hair transplant Turkey risk — 1 in 10 Knee replacement — 1 in 10 Chronic painkillers — 1 in 10 Elderly abandonment — 1 in 9.1 Complete tooth loss — 1 in 9.1 Alzheimer's — 1 in 8.3 Sleep deprivation — 1 in 8.3 Smokeless tobacco — 1 in 8.3 Cycling w/o helmet — 1 in 8.0 Bruxism tooth damage — 1 in 7.7 Vision loss — 1 in 6.7 Hernia from lifting — 1 in 6.7 Hip fracture risk — 1 in 6.7 Regular drinking — 1 in 6.7 First heart attack — 1 in 5.9 Infertility — 1 in 5.7 5+ years paid LTC — 1 in 5.6 CTE (football) — 1 in 5.0 Major depression — 1 in 4.9 Hiking injury — 1 in 4.8 Infection from sharing food with child — 1 in 4.2 Lyme disease — 1 in 4.0 Loneliness & health — 1 in 3.8 Job loss & depression — 1 in 3.7 Inheriting AUD risk — 1 in 3.5 Alcohol use disorder — 1 in 3.4 Menopause CV risk acceleration — 1 in 3.0 Silent diabetes — 1 in 3.0 Flying with cold — 1 in 2.9 Tick illness (forest) — 1 in 2.9 Silent high cholesterol — 1 in 2.9 Grandparent loss in childhood — 1 in 2.8 Pacifier floor drop — 1 in 2.8 Drug-resistant infection — 1 in 2.6 No marrow match — 1 in 2.4 Nursing home admission — 1 in 2.2 Skipping dental checkups — 1 in 2.1 False-positive mammogram — 1 in 2.0 Regular smoking — 1 in 2.0 Travelers' diarrhea — 1 in 2.0 Adventure sports — 1 in 1.8 Family caregiver probability — 1 in 1.8 LTC need after 65 — 1 in 1.8 Widowhood probability — 1 in 1.7 Unprotected sex — 1 in 1.5 Silent hypertension — 1 in 1.3 Chronic back pain — 1 in 1.3 Hand hygiene — 1 in 1.0 Cancer (any) — 1 in 7.1 E-scooter no helmet — 1 in 4.5 E-bike no helmet — 1 in 4.0 Mishandled luggage — 1 in 3.7 Deer collision — 1 in 2.7 At-fault injury crash — 1 in 2.5 Flight cancellation — 1 in 1.8 Trip disruption: war or disaster — 1 in 1.7 Home burglary (global) — 1 in 9.1 Hitchhiking assault — 1 in 8.8 Mail check fraud — 1 in 7.7 Child sexual abuse — 1 in 6.8 Stalking — 1 in 6.2 Student sexual assault — 1 in 5.7 Domestic violence — 1 in 3.7 Night walk assault — 1 in 3.6 Bicycle theft — 1 in 2.9 Sexual assault — 1 in 2.9 Home burglary — 1 in 2.6 Sexual harassment (lifetime) — 1 in 1.6 Water scarcity — 1 in 2.5 Carrington-class solar storm — 1 in 1.9 WAIS tipping point — 1 in 1.1 Indoor cat escape harm — 1 in 10 Off-leash dog bite — 1 in 8.9 Rabbit dies in 4 years — 1 in 3.3 Dog bite (non-fatal) — 1 in 1.8 Hamster dies before teenager — 1 in 1.0 Vitamin D gap — 1 in 2.9 Undercooked food — 1 in 1.6 Raw meat cross-contamination — 1 in 1.4 Food left out — 1 in 1.2 AI voice scam — 1 in 2.9 Online scam loss — 1 in 2.5 Teen cyberbullying — 1 in 2.0 Kids & explicit content — 1 in 1.9 Data breach — 1 in 1.1 Miscarriage — 1 in 6.7 Teen suicide attempt — 1 in 5.6 Postpartum depression — 1 in 4.8 Painkiller before infant vaccination — 1 in 3.8 Excessive pregnancy weight — 1 in 2.6 Unvaxxed child & measles — 1 in 2.0 Elder fraud loss — 1 in 10 Pension fund collapse — 1 in 10 Personal bankruptcy — 1 in 10 Housing crash — 1 in 8.3 Crypto total loss — 1 in 6.7 IRS audit — 1 in 6.7 Visa overstay deportation — 1 in 5.6 Long term disability working age — 1 in 4.0 Student loan default — 1 in 3.8 Whistleblower retaliation — 1 in 3.2 Career obsolescence — 1 in 2.9 Forced job exit before retirement — 1 in 2.9 Retirement shortfall — 1 in 2.6 Divorce — 1 in 2.4 Burst pipe damage — 1 in 2.2 Workplace bullying — 1 in 2.1 Deportation (undocumented) — 1 in 1.8 Funeral cost shock — 1 in 1.8 Identity theft — 1 in 1.7 Credit card fraud — 1 in 1.5 School bullying — 1 in 1.5 Insurance claim denial — 1 in 1.4 Frontline soldier casualty — 1 in 1.3 Economic recession — 1 in 1.0 Stock market crash — 1 in 1.0 Hail roof damage — 1 in 3.0 Dry toilet paper harm — 1 in 100 Secondhand smoke — 1 in 91 Gaming disorder (adults) — 1 in 83 High-heel ER visit — 1 in 79 Child throwing object — 1 in 67 Medication reaction — 1 in 58 Cat litter toxoplasmosis — 1 in 48 Mental health LTD claim — 1 in 45 Drug overdose — 1 in 42 Benzo dependence — 1 in 40 Tap water lead — 1 in 40 Medication misuse — 1 in 35 Traumatic brain injury — 1 in 33 Hospital infection — 1 in 31 Air pollution — 1 in 29 End-stage kidney disease — 1 in 29 Traveler's diarrhea (water) — 1 in 26 Skiing injury — 1 in 26 Bipolar disorder — 1 in 23 Dental tourism complication — 1 in 20 Pet parasites — 1 in 20 Undiagnosed ADHD — 1 in 20 Adult-onset food allergy — 1 in 19 Indoor cooking smoke — 1 in 18 Non-Alzheimer's dementia — 1 in 17 Working-age disabling stroke — 1 in 17 Cannabis use disorder — 1 in 16 Stroke — 1 in 15 Parent death/disability — 1 in 14 Severe hearing loss — 1 in 14 Type 2 diabetes — 1 in 13 Appendicitis — 1 in 13 Untreated depression — 1 in 13 Untreated back pain disability — 1 in 13 Heart disease — 1 in 12 Medical error death — 1 in 12 Compulsive sexual behavior — 1 in 12 Eating disorder — 1 in 11 Hip replacement — 1 in 11 Kidney stones — 1 in 11 Sedentary lifestyle — 1 in 11 Salon infection — 1 in 11 Ovarian cancer — 1 in 91 Colorectal cancer — 1 in 77 Breast cancer — 1 in 59 Liver cancer — 1 in 59 Lung cancer — 1 in 56 Prostate cancer — 1 in 50 Melanoma (UV) — 1 in 29 Low-fiber CRC risk — 1 in 23 Red meat & CRC — 1 in 21 Charred meat & cancer — 1 in 20 Maintenance crash — 1 in 83 Driving on sedating meds — 1 in 77 Texting + driving — 1 in 56 Driving after cannabis — 1 in 53 Eating while driving — 1 in 53 Unbelted crash death — 1 in 53 Speeding 20% over limit — 1 in 48 Motorcycle no helmet — 1 in 45 Spaceflight (astronaut) — 1 in 42 Video watching + driving — 1 in 32 Drowsy driving — 1 in 26 E-scooter injury — 1 in 26 Cruise ship norovirus — 1 in 24 Driving at 0.10% BAC — 1 in 16 Catalytic converter theft — 1 in 83 Pickpocketed while traveling — 1 in 38 Stabbed in an assault — 1 in 37 Vehicle theft — 1 in 34 Street robbery / mugging — 1 in 26 Wrongful conviction — 1 in 24 Drink spiking — 1 in 17 Protest under autocracy — 1 in 12 AMOC collapse — 1 in 20 Sting anaphylaxis — 1 in 50 Cat collar injury — 1 in 25 Fish bone injury — 1 in 68 Restaurant food poisoning — 1 in 58 Vegetarian deficiency — 1 in 25 Intimate deepfake — 1 in 25 Social media problematic use — 1 in 13 Infant fall — 1 in 100 Childbirth death (SSA) — 1 in 55 Co-sleeping death — 1 in 43 Toddler stair fall — 1 in 37 Play swing & slide injury — 1 in 33 Autism diagnosis — 1 in 31 C-section complications — 1 in 29 Toy injury requiring ER (child) — 1 in 21 Preeclampsia — 1 in 20 Severe birth tearing — 1 in 17 Gestational diabetes — 1 in 13 Child fall head injury — 1 in 12 Sports betting financial ruin — 1 in 100 Fighter pilot death — 1 in 48 Commercial fishing career death — 1 in 45 Logging career death — 1 in 34 Dying without heir — 1 in 33 Medical bankruptcy — 1 in 25 Compulsive buying disorder — 1 in 20 Rental listing scam loss — 1 in 20 Mortgage foreclosure — 1 in 14 Musculoskeletal LTD claim — 1 in 14 Day-trading losses — 1 in 13 Extremist govt catastrophe — 1 in 13 Hurricane home destruction — 1 in 17 LASIK complications — 1 in 1,000 Infant pool submersion — 1 in 800 MS — 1 in 769 Workplace fatality — 1 in 690 Typhoid fever — 1 in 654 Unsafe imported products — 1 in 565 Brain aneurysm — 1 in 400 COVID-19 — 1 in 400 Fireworks injury — 1 in 385 Sickle cell disease — 1 in 365 Counterfeit medicine — 1 in 361 Spinal cord injury — 1 in 313 Childhood cancer diagnosis — 1 in 285 Next pandemic death — 1 in 208 Dengue (travel) — 1 in 200 Skipping daily showers — 1 in 200 Not scrubbing feet — 1 in 200 Marrow donation risk — 1 in 167 Schizophrenia — 1 in 143 Accidental fall — 1 in 135 Parkinson's — 1 in 125 Sudden death during exercise — 1 in 123 Suicide (US) — 1 in 121 Opioid addiction — 1 in 114 Tuberculosis (global) — 1 in 108 Radon cancer — 1 in 435 Testicular cancer — 1 in 250 Cervical cancer — 1 in 167 Pancreatic cancer — 1 in 125 Pedestrian death — 1 in 806 Motorcycle crash — 1 in 694 Boating drowning — 1 in 685 Driver kills pedestrian — 1 in 552 Phone-distracted walking injury — 1 in 400 EV battery fire — 1 in 333 Cyclist killed by car — 1 in 196 Hand-held phone call + driving — 1 in 143 Petrol car fire — 1 in 125 Self-driving car fatality — 1 in 115 Car crash — 1 in 105 Firefighter duty death — 1 in 455 Police duty death — 1 in 313 Homicide — 1 in 287 Pig-butchering scam — 1 in 106 Extreme heat — 1 in 333 Climate change death — 1 in 204 Swallowed bee/wasp — 1 in 500 Bat bite & rabies — 1 in 238 Mosquito-borne disease — 1 in 190 Food poisoning (global) — 1 in 317 Solar panel fire — 1 in 667 Untreated childhood scoliosis — 1 in 1,000 Child window fall — 1 in 855 Walker stair fall — 1 in 625 Baby walker injury — 1 in 455 Maternal mortality — 1 in 272 Untreated childhood flat feet — 1 in 250 Maternal age & birth defects — 1 in 200 Child death (<18) — 1 in 143 Caving career death — 1 in 167 EMS duty death — 1 in 794 Civilian war casualty — 1 in 499 Soldier in combat — 1 in 270 Mining career death — 1 in 214 Gambling financial ruin — 1 in 159 Wildfire home destruction — 1 in 120 Lightning home fire — 1 in 105 Malaria (travel) — 1 in 10,000 Infection from shared drink — 1 in 10,000 Chagas disease — 1 in 8,475 Wild berry fox tapeworm — 1 in 8,475 Schistosomiasis death — 1 in 6,667 Sudden death (young adult) — 1 in 3,922 Unsafe wiring — 1 in 3,390 Sepsis from wound — 1 in 2,857 Anesthesia awareness — 1 in 2,500 Heat stroke (outdoor) — 1 in 1,905 House fire — 1 in 1,818 Rabies from dogs — 1 in 1,449 Drowning — 1 in 1,379 Shallow-water diving SCI — 1 in 1,111 Choking — 1 in 1,099 EVALI vaping hospitalization — 1 in 1,064 Betel nut cancer — 1 in 1,290 Blood clot (flight) — 1 in 4,651 Killing a cyclist — 1 in 3,937 Teen road-crash death — 1 in 3,030 Child rear bike seat — 1 in 2,500 Child without restraint — 1 in 2,000 Fatal police encounter — 1 in 4,739 Honor killing — 1 in 2,381 Intimate-partner homicide — 1 in 1,767 Hurricane — 1 in 8,929 Drought famine death — 1 in 6,536 Blizzard death — 1 in 4,367 Earthquake — 1 in 3,802 Dog chocolate death — 1 in 2,000 Food poisoning (US) — 1 in 1,862 Fish mercury — 1 in 1,695 Phone/laptop battery fire — 1 in 1,136 SIDS — 1 in 7,143 Laundry pod ingestion — 1 in 6,494 Untreated infant hip dysplasia — 1 in 5,000 Pool drowning — 1 in 2,299 War (civilian) — 1 in 2,000 Fatal bee/wasp sting — 1 in 76,923 Anesthesia death — 1 in 50,000 Dog hot car death — 1 in 41,667 Anaphylaxis — 1 in 27,548 Chiropractic neck manipulation — 1 in 16,667 CO poisoning — 1 in 14,006 Hepatitis A (travel) — 1 in 12,500 Skipping allergy immunotherapy — 1 in 11,111 Acrylamide & cancer — 1 in 16,667 Bus crash — 1 in 100,000 Plane crash — 1 in 58,824 Child pedestrian (residential) — 1 in 45,455 Railroad crossing death — 1 in 20,704 Child bike trailer — 1 in 14,286 Acid attack — 1 in 89,286 Terrorism — 1 in 77,519 Child stranger abduction — 1 in 38,760 Stranger kidnapping — 1 in 35,211 Dowry death — 1 in 13,158 Accidental gun death — 1 in 11,299 Wildfire — 1 in 100,000 Tornado — 1 in 80,645 Tsunami — 1 in 52,632 Ocean drowning — 1 in 29,155 Flood — 1 in 20,202 Landslide death — 1 in 18,416 Supervolcano eruption — 1 in 12,376 Crocodile attack — 1 in 84,746 Bee sting — 1 in 78,927 Fatal scorpion sting — 1 in 26,110 Plastic container leaching — 1 in 16,949 Infant in car seat — 1 in 64,935 Bouncer chair fall — 1 in 60,606 Toddler choking — 1 in 50,000 Unsupervised infant choking — 1 in 50,000 Magnet ingestion — 1 in 12,048 Snorkeling death — 1 in 21,739 Pet in transport — 1 in 20,000 Landmine or UXO injury — 1 in 14,728 Vaccine reaction — 1 in 763,359 Aluminum & Alzheimer's — 1 in 169,492 Residential gas leak — 1 in 140,845 Child hot car death — 1 in 102,041 Glyphosate & cancer — 1 in 1,000,000 Teflon cookware cancer — 1 in 169,492 Roller coaster injury — 1 in 312,500 Cruise ship accident — 1 in 188,679 Ferry sinking — 1 in 133,333 Turbulence injury — 1 in 114,943 School shooting — 1 in 192,308 Mass shooting — 1 in 113,636 Nuclear accident — 1 in 833,333 Avalanche — 1 in 210,526 Lightning — 1 in 209,205 Snake bite — 1 in 884,956 Spider bite — 1 in 833,333 Hippo attack — 1 in 564,972 Dog bite — 1 in 142,045 Pesticide residue — 1 in 1,000,000 Dirty can illness — 1 in 200,000 PLA bioplastic harm — 1 in 169,492 Charger left plugged in — 1 in 200,000 Infant swing death — 1 in 714,286 Child blind cord strangulation — 1 in 416,667 Child plastic bag suffocation — 1 in 263,158 Button battery — 1 in 250,000 Inclined sleeper death — 1 in 238,095 Elevator/escalator death — 1 in 188,324 Japanese encephalitis (travel) — 1 in 2,000,000 Kid + front airbag — 1 in 10,000,000 Asteroid impact — 1 in 1,351,351 Banana spider eggs — 1 in 10,000,000 Shark attack — 1 in 5,681,818 Bear attack — 1 in 3,787,879 Wild berry poisoning — 1 in 2,222,222 Space debris hits property — 1 in 10,000,000 Piranha attack — 1 in 135,135,135 Phone at gas pump — 1 in 1,000,000,000 Phone on plane — 1 in 1,000,000,000 Alien contact — 1 in 169,491,525
Lottery jackpot 1 in 95,238