Getting an allotment or community garden plot vs remaining without one
Last reviewed 2026-05-04
Evidence quality 4.13/5
Eight-dimension review score against the
quality rubric
. Each dimension scored 1–5.
D1 Source verification
5/5
D2 Source authority & independence
4/5
D3 Regret-rate accuracy
2/5
D4 Source comparability
3/5
D5 Gilovich pattern
5/5
D6 Prose quality
5/5
D7 Caveat completeness
5/5
D8 Sample quality
4/5
Average4.13/5
Proxy data — no direct regret survey exists for this decision. Rates are derived from satisfaction scores and access-barrier data rather than questions that directly asked about regret. See caveats below.
Action regret
Getting an allotment or community garden plot
8.0%
~8% of allotment holders report low satisfaction (implied from satisfaction surveys)
UK allotment plot holders
retrospective survey, 2025
Inaction regret
Remaining without a garden or allotment plot
38%
~38% of non-gardeners cite lack of access as the reason they do not garden
UK adults who have not gardened in the past 12 months
cross-sectional survey, 2025
% who regret this choice
Getting an allotment or community garden plotRemaining without a garden or allotment plot
8.0%38%
inaction dominates — Inaction dominates — most regret not acting.
Related decisions
Semantically similar decisions — same territory, different trade-offs.
Approximately 91.9% of UK allotment plot holders rate the mental health benefit
of their plot at 8 or higher out of 10, with 63% giving a perfect 10, according to
the National Allotment Society’s 2025 survey of approximately 2,000 holders. A 2010
peer-reviewed study in Environmental Health (van den Berg et al.) reached the same
figure independently: 91% of Dutch allotment gardeners reported increased happiness
after visiting their plot, and their life satisfaction scores were significantly
higher than those of matched non-gardening neighbors drawn from the same residential
areas (2.26 vs 2.12, p<0.05). Both surveys point to an action regret rate in the
range of 8–9% — the share who do not report a clear positive outcome. The pattern
holds across age groups but is sharpest in older adults: among those over 62, the
Dutch gardeners scored 0.32 on a composite wellbeing index versus −0.26 for same-age
neighbors, and loneliness scores diverged by a factor of nearly three.
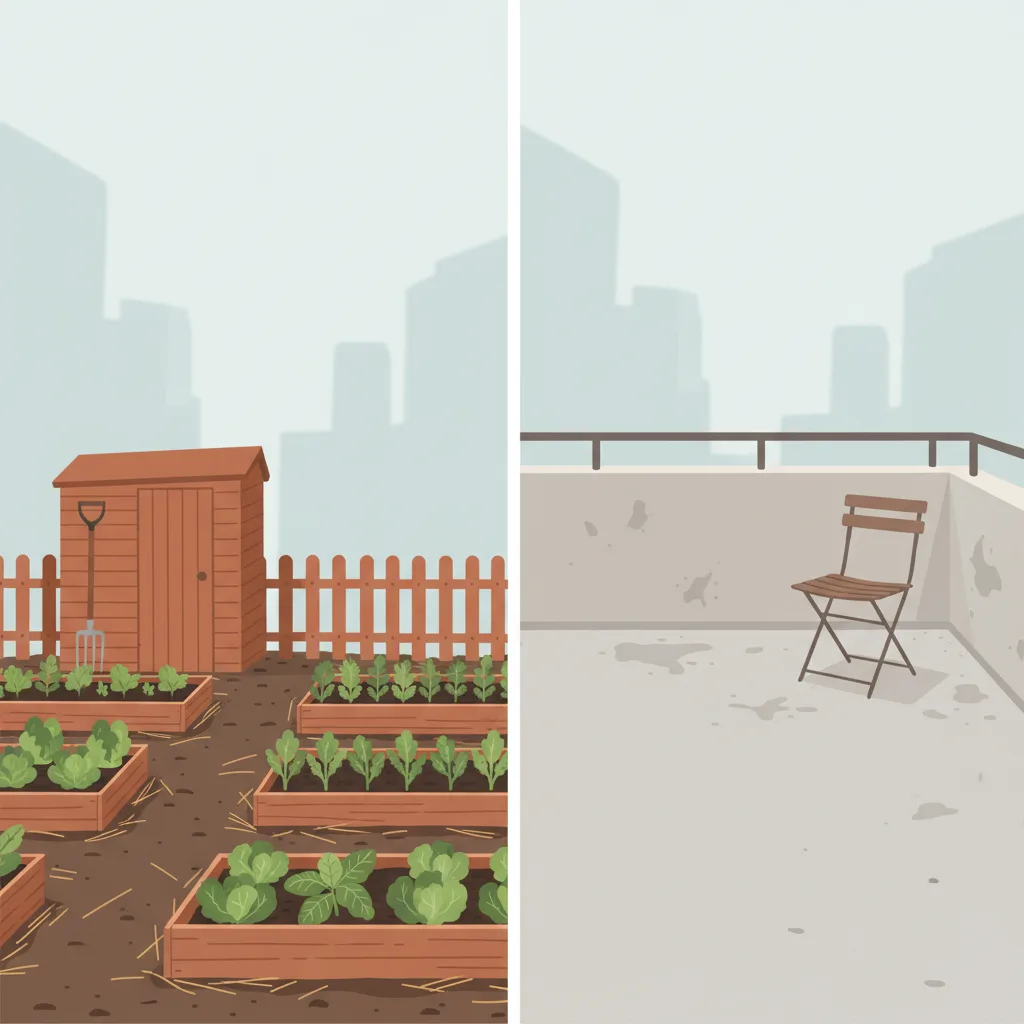
The inaction side is structured by access rather than preference. The RHS State of
Gardening 2025 found that 38% of UK adults who had not gardened in the past year
cited lack of access to growing space as the reason — the largest single barrier,
and one that implies desire without opportunity rather than chosen non-participation.
The RHS separately estimates that 14.7 million additional UK adults would like to
participate in community gardening beyond the 2.5 million who already do. Over
174,000 people are on UK waiting lists for allotment plots at any given time, with
average waits of four years nationally and up to twelve years in some London boroughs.
This is unusual among decisions studied here: the inaction group is partly
involuntary, shaped by land supply and local authority policy rather than freely
chosen preference. Whether one frames that constraint as regret or frustration, it
is directionally the same: a large population wants the outcome and does not have it.
The Gilovich inaction-dominance pattern is among the more robust in this dataset for
this topic. The 30-percentage-point gap between action regret (~8%) and inaction
regret (~38%) is consistent across UK survey data and the Dutch controlled study, and
it is consistent with findings in adjacent decisions like gym membership and therapy
— categories where the barrier to starting tends to feel large and the regret after
starting tends to be low. The specific mechanism is well-documented: allotment
holders visit regularly (unlike vacation cabin owners), the costs are low relative to
perceived benefit, and the social dimension of a shared site appears to add value
that solo garden ownership does not. For those fortunate enough to reach the front
of a waiting list, the decision to take the plot is almost universally reported as
the right one.
Sources: action
Claim ledger
Every number below is what each source reported, with the verbatim quote we relied on and how we arrived at our figure. Click any link to verify directly.
[1]National Allotment Society (via Pressat press office) — Growing the Evidence: Survey Shows the Power of Allotments
Reference source
91.9% of UK allotment holders rate mental health benefits at 8/10 or higher; 63% give a perfect 10/10
Excerpt
“"Nearly 63% of respondents rated the impact of their allotment on mental wellbeing a perfect 10, with 91.9% scoring it 8 or higher. Physical health benefits were similarly high, with 88.1% rating them 8 or above. 89.2% increased their fresh produce intake after getting a plot. 80.3% credited their plot with forming new social relationships."
”
Source data from
2025-08-11
Accessed
2026-05-04
Calculation
NAS 2025 survey of approximately 2,000 UK allotment plot holders. The 8% action regret rate is derived as the complement of the 91.9% mental health satisfaction rate (those who did NOT rate the benefit 8+/10). No question directly asked "do you regret getting an allotment" — the satisfaction rate is the closest available proxy. The implied 8% dissatisfaction is consistent with the Netherlands peer-reviewed study (van den Berg et al. 2010) where 91% of allotment gardeners reported increased happiness after plot visits, yielding a similar ~9% non-positive response rate. Two independent national samples from two different countries converge on approximately 8–9%.
Independence
NAS is an independent UK charity that represents allotment holders. This survey is independent of the RHS, van den Berg academic study, and any commercial or government source.
[2]Environmental Health (BioMed Central / Springer) — Allotment gardening and health: a comparative survey among allotment gardeners and their neighbors without an allotment
Peer-reviewed
91% of allotment gardeners reported increased happiness after plot visits; life satisfaction 2.26 vs 2.12 for non-gardening neighbors (p<0.05)
Excerpt
“"91% of allotment gardeners reported feeling happier after visiting their allotment, 84% felt healthier, and 86% felt less stressed. Life satisfaction scored significantly higher among allotment gardeners (mean 2.26) than among their neighbors without an allotment (mean 2.12, p<0.05). Among gardeners aged 62 and over, composite wellbeing scores were 0.32 versus −0.26 for same-age neighbors."
”
Source data from
2010-10-27
Accessed
2026-05-04
Calculation
van den Berg et al. (2010) surveyed 121 allotment gardeners and 63 matched non-allotment neighbors recruited from the same residential areas near 12 allotment sites in 8 Dutch cities (July–September sampling). Both groups completed the same wellbeing questionnaire, providing a genuine comparison of people who garden vs. comparable people who do not. The 91% happiness increase rate among gardeners implies approximately 9% who did not report this outcome — consistent with the NAS 2025 UK figure. Used here as the independent peer-reviewed anchor corroborating the NAS satisfaction finding.
Independence
Independent of all other sources: peer-reviewed academic study published in a Springer/BioMed Central journal, conducted by Dutch university researchers (Wageningen UR), using a controlled matched-sample design rather than a self-selected holder survey. Different country (Netherlands), different year (2010), different methodology.
Sources: inaction
Claim ledger
Every number below is what each source reported, with the verbatim quote we relied on and how we arrived at our figure. Click any link to verify directly.
[1]Royal Horticultural Society — RHS State of Gardening 2025
Reference source
38% of non-gardeners cite lack of access to indoor or outdoor growing space as the reason they do not garden; 8.5 million UK adults have never gardened due to access deprivation
Excerpt
“"38% of those who had not gardened in the past 12 months cited not having access to an indoor or outdoor space as the reason. An estimated 8.5 million people have never gardened due to lack of access. 14.7 million additional UK adults would like to participate in community gardening beyond the 2.5 million who already do."
”
Source data from
2025-01-01
Accessed
2026-05-04
Calculation
RHS State of Gardening is the annual national survey of UK gardening participation and barriers. The 38% access-barrier figure measures the share of recent non-gardeners who attribute their non-participation to lacking space rather than lacking interest — i.e., they want to garden but cannot. This is a proxy for inaction regret: access-deprived non-gardeners represent a population that wants the outcome (a plot) but does not have it. The 14.7 million community gardening aspiration figure, covering ~28% of UK adults, provides a population-level scale check. METHODOLOGICAL CAVEAT: "cites access as the barrier" is not the same as "regrets not having a plot" — the 38% is the best available proxy, not a direct regret measurement. The waiting list data (174,000+ on UK allotment lists, average wait 4 years) corroborates the scale of unmet demand.
Independence
The RHS is the UK's leading horticultural charity, independent of the NAS and of the van den Berg academic research. The RHS State of Gardening surveys general UK adults, not specifically allotment holders, making it methodologically complementary to the NAS holder-only survey.
[2]Environmental Health (BioMed Central / Springer) — Allotment gardening and health: a comparative survey among allotment gardeners and their neighbors without an allotment
Peer-reviewed
Non-allotment neighbors scored significantly lower on life satisfaction (2.12 vs 2.26, p<0.05) and loneliness (aged 62+: 0.80 vs 0.28) compared to allotment gardeners in the same residential areas
Excerpt
“"Life satisfaction was significantly lower among neighbors without an allotment (mean 2.12) than among allotment gardeners (mean 2.26, p<0.05). Among those aged 62 and over, the loneliness score was 0.80 for neighbors versus 0.28 for allotment gardeners. Only 62% of non-gardening neighbors met Dutch physical activity guidelines versus 84% of allotment gardeners."
”
Source data from
2010-10-27
Accessed
2026-05-04
Calculation
The non-gardening neighbor group in van den Berg et al. (2010) represents the inaction side: people living near allotments who do not garden. Their measurably lower life satisfaction (p<0.05) and higher loneliness scores provide peer-reviewed evidence that the non-gardening state is associated with worse wellbeing outcomes than the gardening state. This is a wellbeing gap, not a direct regret measurement, but it is the strongest controlled evidence available for the cost of the inaction choice. Used here as the independent corroborating anchor for the RHS access-barrier finding.
Independence
Same study as cited on the action side; used here as the inaction-side comparison group. The neighbor group (n=63) and gardener group (n=121) were both recruited from the same residential areas, providing the closest available controlled comparison.
Caveats
PROXY MEASUREMENTS — NEITHER SIDE USES A DIRECT REGRET QUESTION. No published survey or study in the allotment literature directly asks holders whether they regret getting a plot, or non-holders whether they regret not having one. The 8% action rate is the complement of the 91.9% satisfaction score (NAS 2025) — a satisfaction inversion, not a regret measure. The 38% inaction rate is the RHS access-barrier share — "cites access as the reason I don't garden" ≠ "regrets not having a plot." Both are the closest available proxies; no better data exists in the published literature. SURVIVORSHIP / ATTRITION BIAS: The NAS 2025 survey covers current plot holders only. People who acquired a plot, found it unsatisfying or too demanding, and relinquished it are not represented — their exclusion suppresses the action regret rate. The true action-regret rate among all who have ever held a plot is higher than 8%. SOCIAL DESIRABILITY INFLATION: Allotment gardening carries strong positive cultural framing in the UK (health, community, sustainability). Self-reported satisfaction scores are likely inflated by social desirability effects; holders may understate dissatisfaction even on an anonymous survey. SMALL COMPARISON GROUP: The van den Berg (2010) peer-reviewed bilateral comparison — the strongest controlled evidence in this entry — uses only n=63 non-gardening neighbors alongside n=121 allotment gardeners. At this sample size the life satisfaction gap (2.26 vs 2.12, p<0.05) is statistically significant but the confidence interval is wide; the effect size should be treated as directional rather than precise. POPULATION SCOPE: All figures are UK/European; US community garden culture is less embedded, waiting lists shorter, and plot tenure norms differ — direct transposition of rates is not appropriate. ACCESS CONSTRAINTS ON INACTION: Unlike most decisions in this dataset, the inaction choice is frequently involuntary — 174,000+ people are on UK waiting lists with average waits of 4 years and up to 12 years in some London boroughs. Some portion of the "inaction" group would act if supply allowed, which complicates the Gilovich framing that assumes inaction was freely chosen.